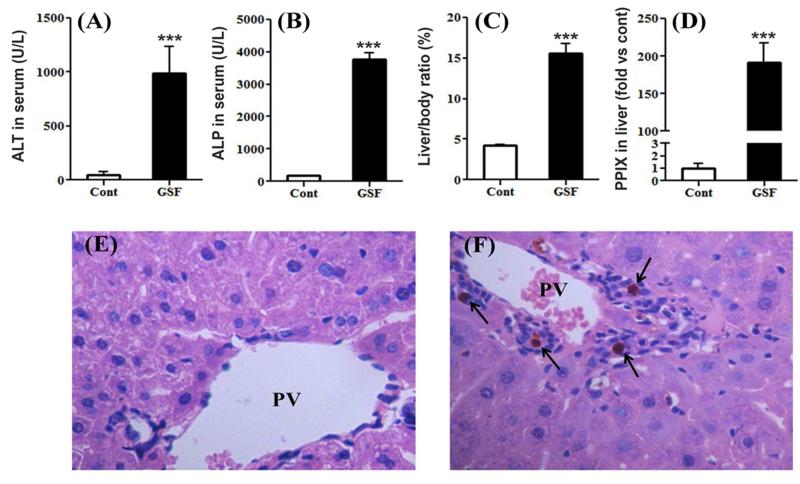
Figure 1. GSF-induced liver injury in mice.
WT mice were treated with control diet or GSF diet for 14 days. A and B, ALT and ALP activities in serum. C, liver to body weight ratios. D, relative quantification of PPIX levels in the liver. All data are expressed as means ± S.D. (n=4). The data in control group were set as 1. ***P < 0.005 vs control. E and F, histological analysis of liver from control (E) and GSF group (F), H&E staining, 200 X. PV, portal vein. Arrows point to bile plugs.

