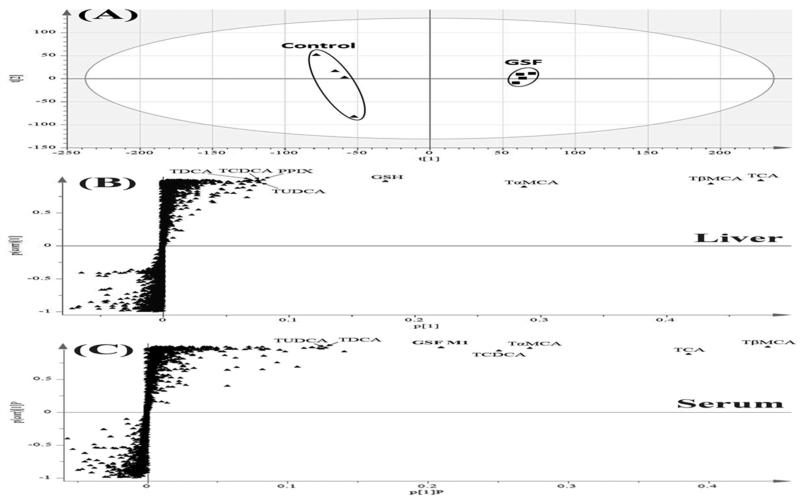
Figure 2. Metabolomic analysis of samples from mice treated with GSF.
All samples were analyzed by UPLC-QTOFMS in negative mode. A, Separation of liver samples from the control and GSF groups in a PCA score plot. The t[1] and t[2] values represent the score of each sample in principle component 1 and 2, respectively. B and C, loading S plots of liver (B) and serum (C) samples generated by OPLS-DA analysis. The x-axis is a measure of the relative abundance of ions, and the y-axis is a measure of the correlation of each ion to the model. Top ranking ions were labeled.

