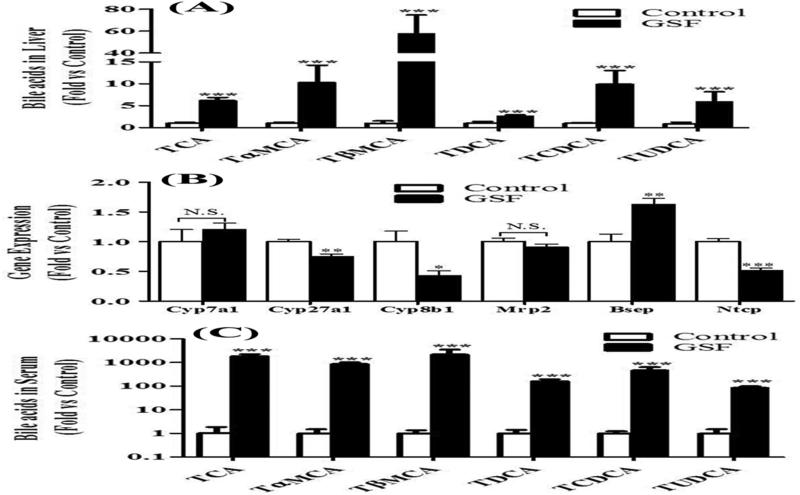
Figure 3. Accumulation of bile acids in mice treated with GSF.
Bile acids were analyzed by UPLC-QTOFMS. A, relative abundances of TCA, TɑMCA, TβMCA, TDCA, TCDCA and TUDCA in the liver. B, expression of genes responsible for bile acid synthesis (Cyp7a1, Cyp27a1 and Cyp8b1) and transport (Mrp2, Bsep and Ntcp) in the liver. C, relative abundances of bile acids in serum. All data are expressed as means ± S.D. (n=4). The data in control group were set as 1. *P < 0.05; **P < 0.01; ***P < 0.005 vs control. N.S., not significant.

