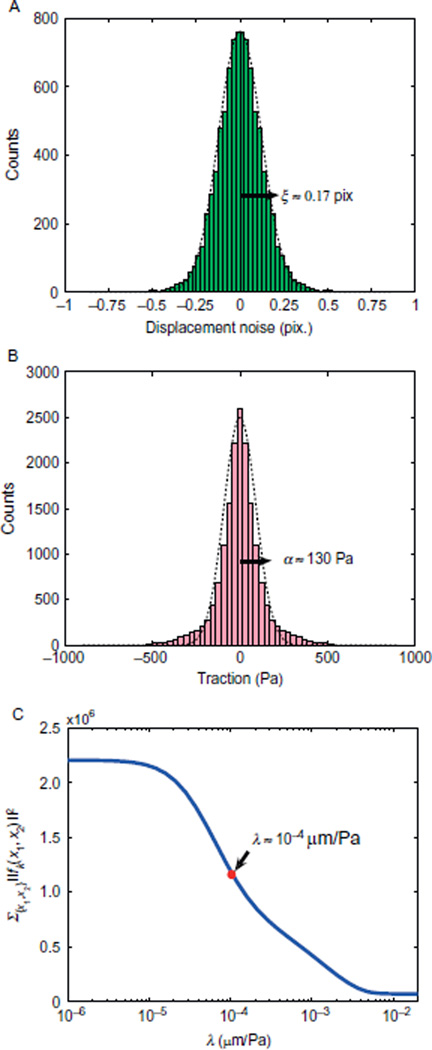
FIGURE 20.3.
Choice of the regularization parameter. (A) Histogram of the displacement error obtained by tracking beads in a region where no gel deformation occurs. Dotted line is a Gaussian fit. (B) Histogram of symmetrized traction in x1 and x2 directions. Data were collected from adhesion sites and their immediate proximity in one cell. A Gaussian fit (dotted line) allows to estimate the prior distribution of traction. (C) Example for the dependence of the overall traction magnitude on the regularization parameter.

