
Figure 4.
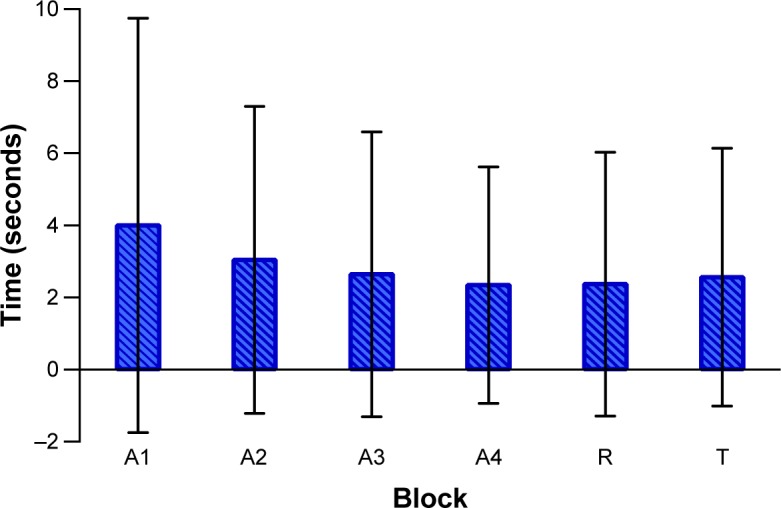
Difference between the groups in each trial block (mean ± standard deviation).
Note: The x- and y-axis represent, respectively, each trial block and the time of the DMD group minus the time of the TD group in seconds.
Abbreviations: A1, first acquisition block; A2, second acquisition block; A3, third acquisition block; A4, fourth acquisition block; R, retention test block; T, transfer test block; DMD, Duchenne muscular dystrophy; TD, typical development.