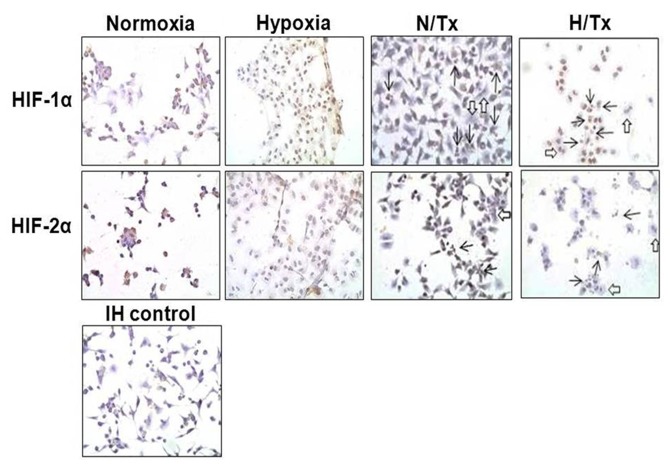
Figure 4.
HIF-1α and HIF-2α immunocytochemistry in 2-ME-treated A549 cells. Cells were cultured under normoxia (first and third columns) or hypoxia (second and fourth columns) and with (third and fourth columns) or without (first and second columns) 10 µM 2-ME. Both HIFs showed modest but similar reduction in the extent and intensity of expression in the cells treated with 2-ME. Open arrows indicate nuclear lobation; solid arrows indicate nuclear fragmentation. IH control (bottom panel), immunocytochemistry control cells without the primary antibody. Magnification, ×400.

