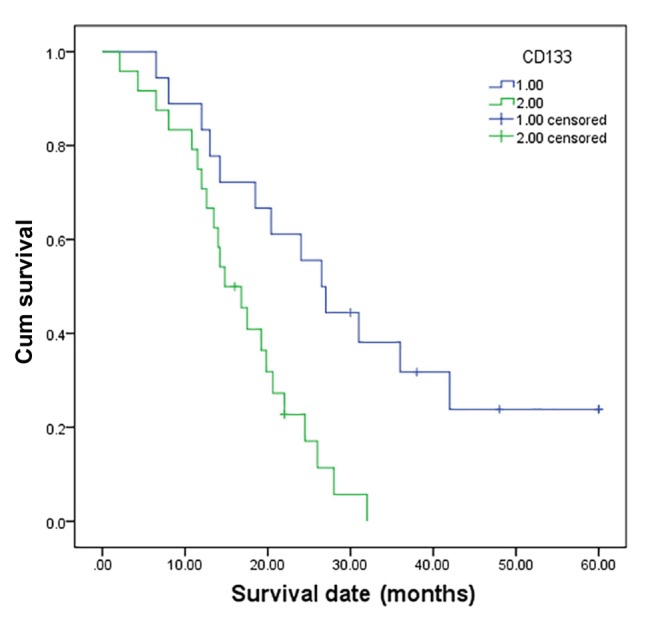
Figure 3.

Kaplan-Meier survival analysis according to CD133 status (n=43). The y-axis indicates the percentage of patients, and the x-axis depicts their survival in months. The green line represents the patients with high CD133 expression, who showed a trend of worse survival than those with low CD133 expression, indicated by the blue line. The mean overall survival (OS) time was 16.2 months for the high CD133 expression group and 27.4 months for the low CD133 expression group (P=0.000).
