
Figure 5.
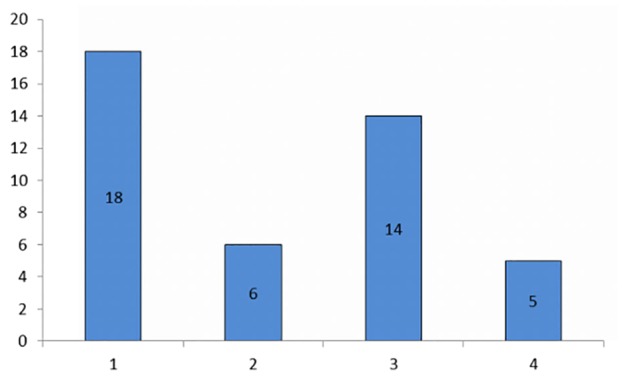
Inverse correlation between Lxn and CD133 expression. From left to right, expression of latexin compared with that of CD133 (n=43), classified as low to high (1, n=18), high to high (2, n=6), high to low (3, n=14) and low to low (4, n=5) (r=−0.485, P=0.001).