Figure 5.
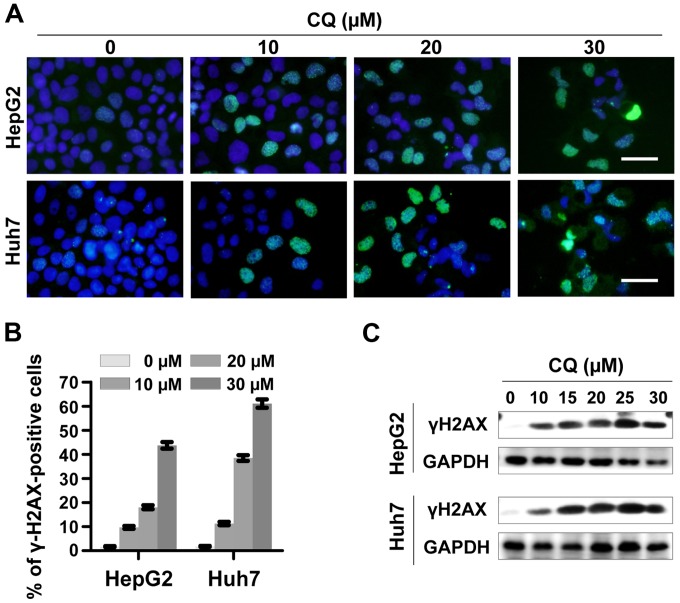
Treatment with chloroquine (CQ) induces DNA damage. (A and B) γH2AX foci were determined by immunofluorescence. HepG2 and Huh7 cells were treated with CQ at the indicated concentrations. γH2AX foci were determined by immunofluorescence. Representative images are shown in A. (B) Cells with >10 foci were counted and the quantified data were plotted. Scale bar, 0.5 µm. (C) The expression of γH2AX was determined by western blot analysis. HepG2 and Huh7 cells were treated with CQ at the indicated concentration for 72 h. Cell extracts were subjected to western blot analysis for γH2AX. GAPDH served as a loading control.

