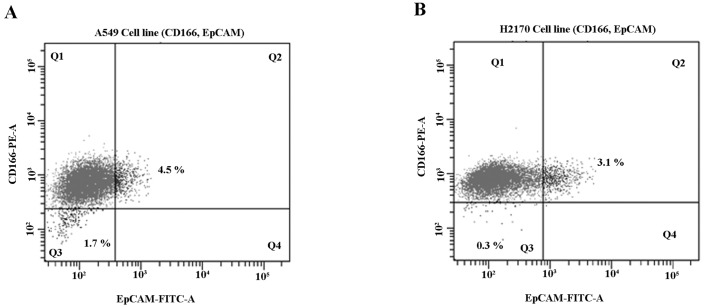
Figure 3.
Sorting of double-positive (CD166+/EpCAM+) and double-negative (CD166−/EpCAM−) subpopulations in NSCLC cell lines (A549 and H2170). Both NSCLC cell lines were analysed for subpopulations using CD166-PE and EpCAM-FITC and sorted by flow cytometry. A549 cells showed 4.5% (Q2) expression of double-positive and 1.7% (Q3) expression of double-negative subpopulations (A), while H2170 presented with 3.1% (Q2) double-positive and 0.3% (Q3) double-negative subpopulations (B).

