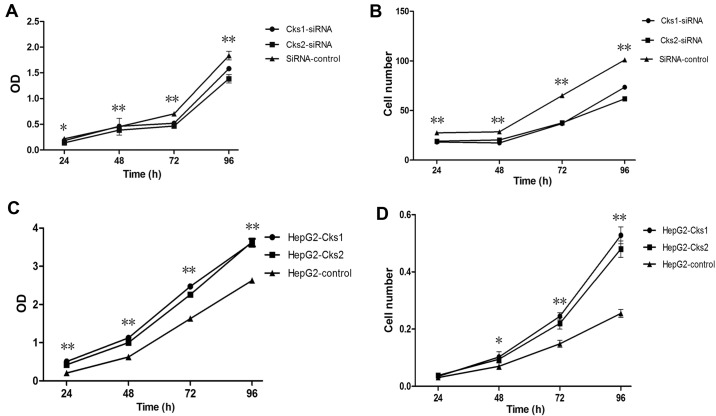
Figure 2.
The effect of changes in Cks1/2 protein levels on HepG2 proliferation. (A) CCK-8 assay curve for transient siRNA transfection. (B) The cell counting curve for transient siRNA transfection. (C) CCK-8 curve for the Cks1/Cks2 overexpressed cell lines. (D) The cell counting curve for Cks1/Cks2 overexpressed cell lines. **P<0.01, *P<0.05. Suppression of the expression of Cks1 and Cks2 protein resulted in slower proliferation.

