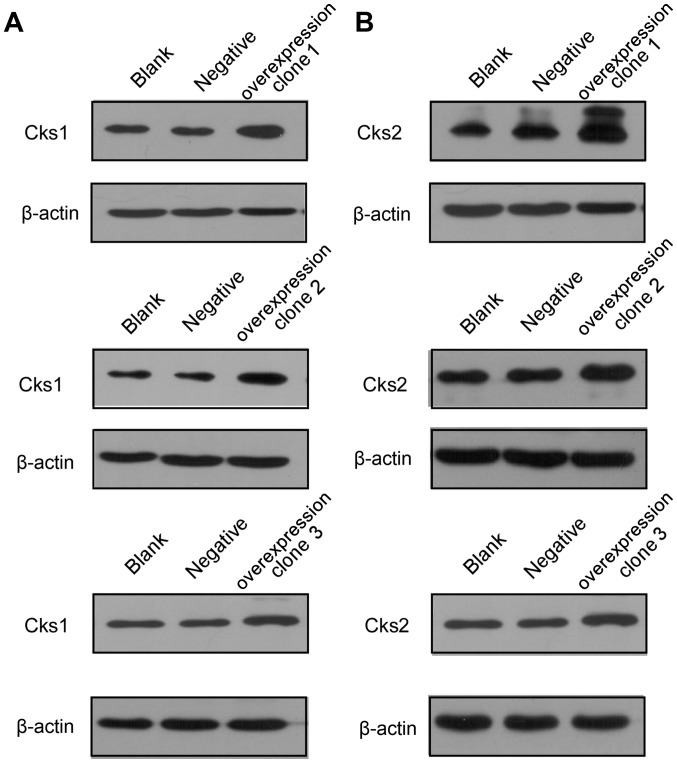
Figure 3.
Cks1 and Cks2 protein levels in the overexpressed stable cell lines. (A) Cks1 protein levels in the stable overexpressed cell line. (B) Cks2 protein levels in the stable overexpressed cell line. Overexpression in clones 1–3 represent Cks overexpression of clone 1–3. Negative, negative control, and the blank is untreated HepG2 cells. After transfection of target plasmids, Cks1 and Cks2 protein expression levels were markedly higher in overexpressed cell lines than in the control groups.

