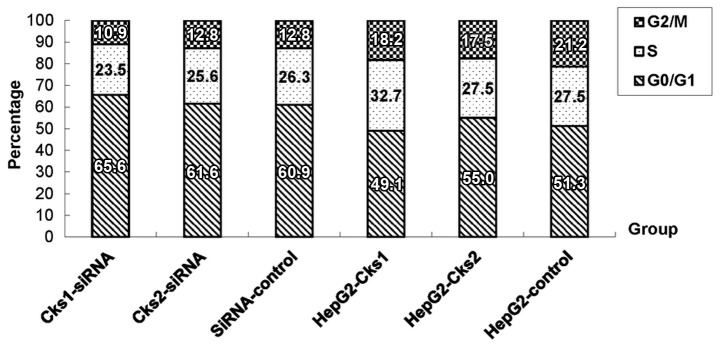
Figure 4.
Effect of the changes in Cks1 and Cks2 protein levels on cell cycle in HepG2 cells. The statistical analysis showed that upregulation of Cks1 protein level increased the percentage of cells in S phase (P<0.01) and decreased the percentage of cells in G0/G1 and G2/M (P<0.01) compared to the control. Overexpression of Cks2 only increased the percentage of cells in G0/G1 (P<0.05) and decreased the percentage of cells in G2/M (P<0.01) compared to the control while the percentage of cells in S phase show no significant difference. The percentage of cells in each phase after Cks1 and Cks2 siRNA transfection was not significantly different from the control.

