
Fig 2. Sensitivity estimation of the Ion PGM.
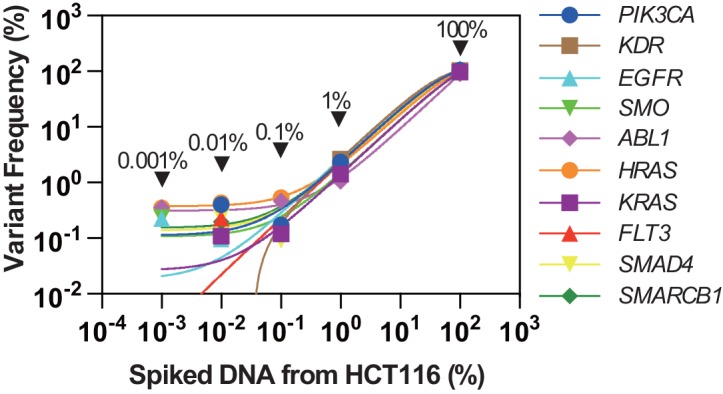
The horizontal axis indicates the concentration of spiked DNA from the HCT116 colon cancer cell line in the solution of DNA from a healthy non-cancer donor. HCT116 is known to possess several gene mutations and thus the concentration of the mutation fragment was serially diluted. The vertical axis is the allele frequency that is actually detected with the Ion PGM. Each color point indicates the detected allele frequency of cancer-associated mutations at the corresponding DNA concentration derived from HCT116 ranging from 0.001 to 100%. The names of the mutated genes are indicated in the legend on the right.