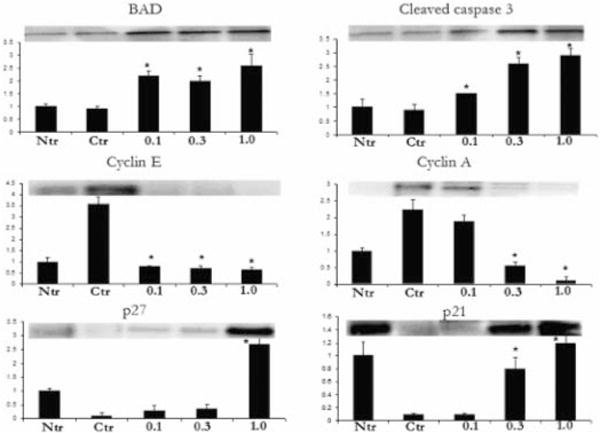
FIG. 4.

Mixed tocotrienols alter the expression levels of apoptotic proteins BAD and cleaved caspase 3 and cell cycle regulatory proteins cyclin E, cyclin A, p21, and p27. Densitometric analysis of the band intensity of each protein was adjusted with β-actin (loading control) and is shown as histograms. Note that the β-actin band is not shown. The bars represent mean values ±SE. Statistical significance of the difference between control and treated groups was analyzed by Student’s t-test. P values < 0.01 were considered significant. Ntr, nontransgenic; Ctr, control.
