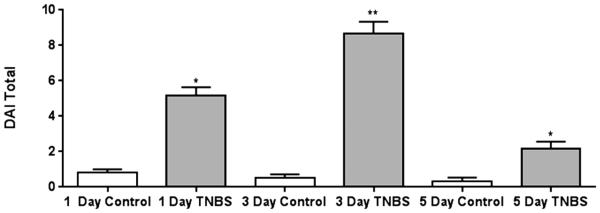
Figure 5.
Daily Disease Activity Index (DAI) following intra-colonic TNBS. Filled bars indicate rats treated with TNBS. Open bars represent control mice. There was a significant increase in the DAI in TNBS-treated rats compared to paired controls at all time points, with the highest level of severity occurring at 3 days post-TNBS infusion *p<0.05,**p<0.01 compared to controls.

