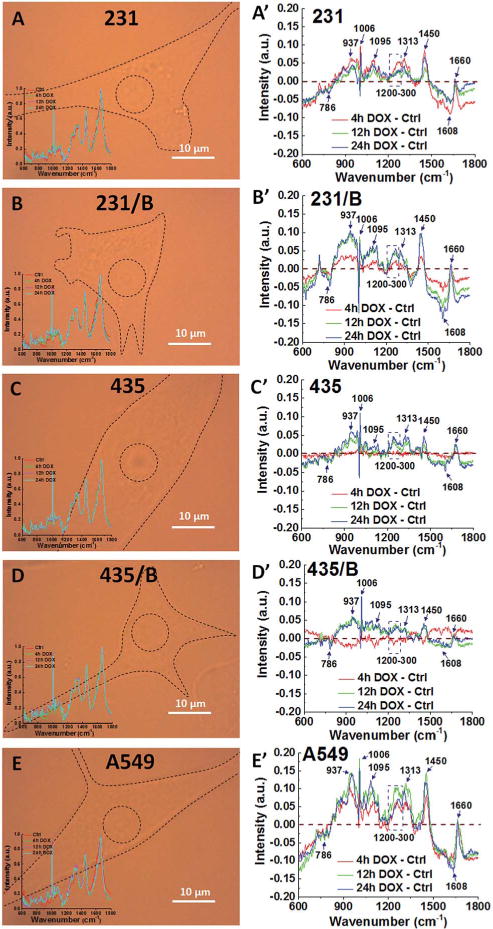
Fig. 3.

Similar Raman peaks corresponding to DNA/RNA, lipids and proteins between cell lines have noticeable changes for all cancer cells after DOX treatment. The representative Raman video images of (A) 231, (B) 231/BRMS1, (C) 435, (D) 435/BRMS1 and (E) A549 (inset in each image is the average Raman spectra from nucleus of control and treated with DOX for 4 h, 12 h and 24 h). Spectra difference between different time (4 h, 12 h and 24 h) of DOX treated cells and control cells of (A′) 231, (B′) 231/BRMS1, (C′) 435, (D′) 435/BRMS1 and (E′) A549 (B represents as BRMS1 in the figure).
