
Fig. 6.
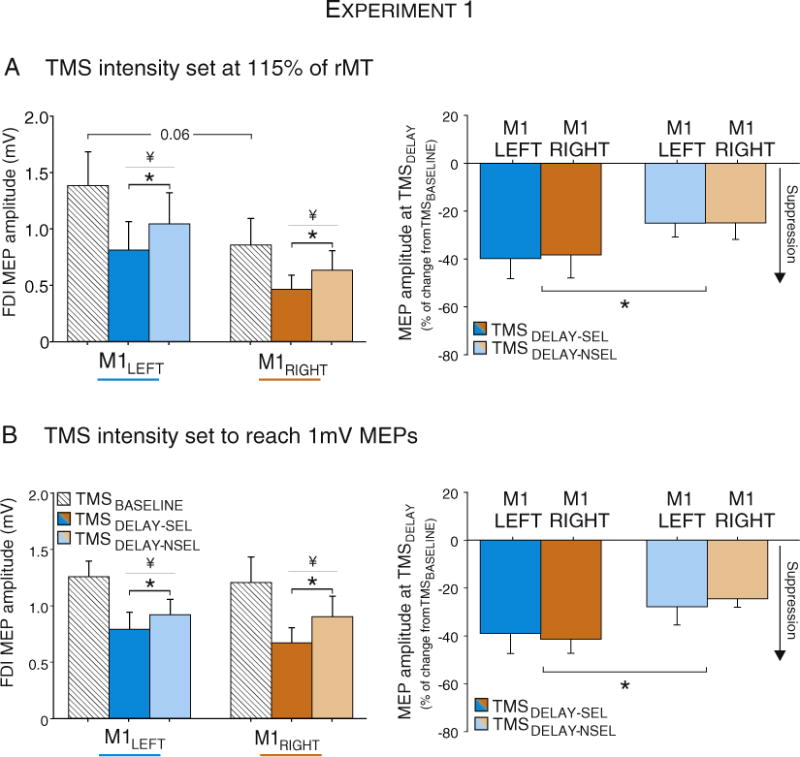
MEP amplitudes following right (M1RIGHT) and left hemisphere stimulation (M1LEFT) recorded at TMSDELAY in the TMS115% (Panel A, n = 12) or the TMS1 mV (Panel B, n = 12) groups of Experiment 1. MEPs are shown in mV (left panel) and expressed as a percent change with respect to MEPs elicited at TMSBASELINE (right panel). * = significantly different (p-value < 0.05). MEP suppression at TMSDELAY was more pronounced in a selected muscle (TMSDELAY-SEL) than in a non-selected muscle (TMSDELAY-NSEL). No differences were found between M1RIGHT and M1LEFT conditions. ¥ = significantly different (p-value < 0.05) from MEPs elicited at TMSBASELINE.