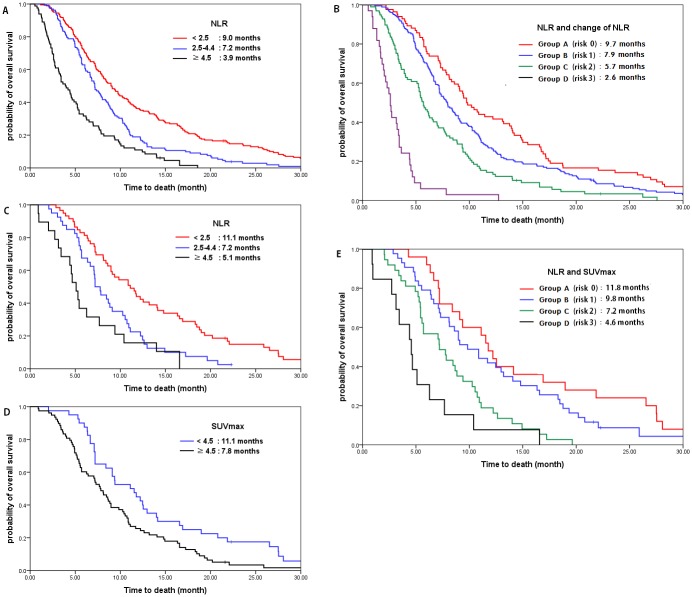
Fig 1. Relationship of NLR and SUVmax with overall survival.
(a) Overall survival according to NLR in all patients (N = 396): NLR <2.5: reference; NLR 2.5–4.4: HR 1.659, P<0.001; NLR ≥4.5: HR 2.926 (P<0.001). (b) Overall survival according to the risk scores of whole patients (N = 396): Group A (score 0), group B (score 1), group C (score 2), group D (score 3). Total risk score of patients were calculated by addition of each score of NLR (score 0, NLR <2.5; score 1, 2.5≤ NLR <4.5; score 2, NLR ≥4.5) and ΔNLR (score 0: ΔNLR <0; score 1: ΔNLR ≥0). (c) Overall survival according to NLR in PET cohort (N = 118): NLR <2.5: reference; NLR 2.5–4.4: HR 2.113, P = 0.002; NLR ≥4.5: HR 3.500, P<0.001. (d) Overall survival according to SUVmax in PET cohort (N = 118): SUVmax <4.5: reference; SUVmax ≥4.5: HR 1.845, P = 0.004. (e) Overall survival according to risk scores with NLR and SUVmax in PET cohort (N = 118): Group A (score 0), group B (score 1), group C (score 2), group D (score 3). Total risk score of patients were calculated by addition of each score of NLR (score 0, NLR <2.5; score 1, 2.5≤ NLR <4.5; score 2, NLR ≥4.5) and SUVmax (score 0: SUVmax <4.5; score 1: SUVmax ≥4.5).

