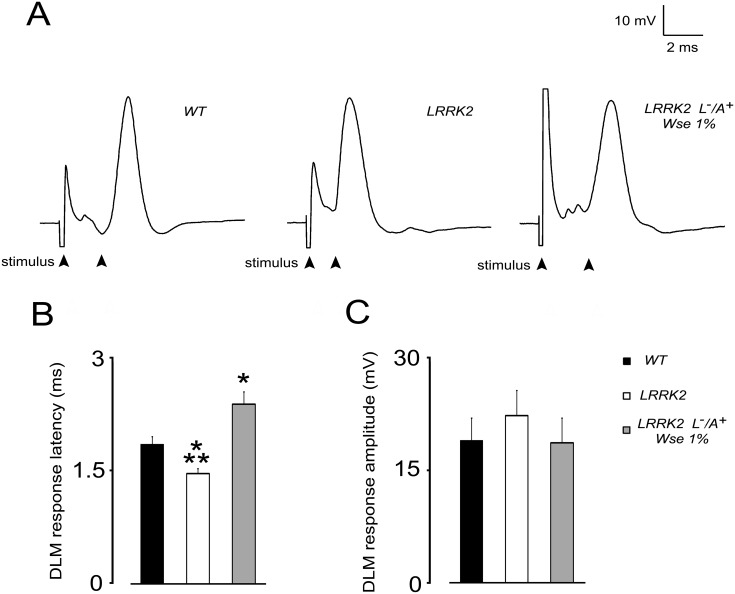
Fig 3. Effect of LRRK2 gene mutation and treatment with Wse 1% (L-/A+) on PSP latency and amplitude recorded from Drosophila DLM.
(A) Representative traces obtained from three different flies in which PSP latency is calculated as the time (ms) from stimulus application to the peak of PSP (black arrows). (B, C) Bar graphs represent the mean ± SEM of PSP latency (ms) and amplitude (mV) recorded from flies of the indicated experimental groups. *indicates p< 0.05 compared to WT, **indicate p<0.05 compared to treated LRRK2; one-way ANOVA, followed by Bonferroni post-hoc test.

