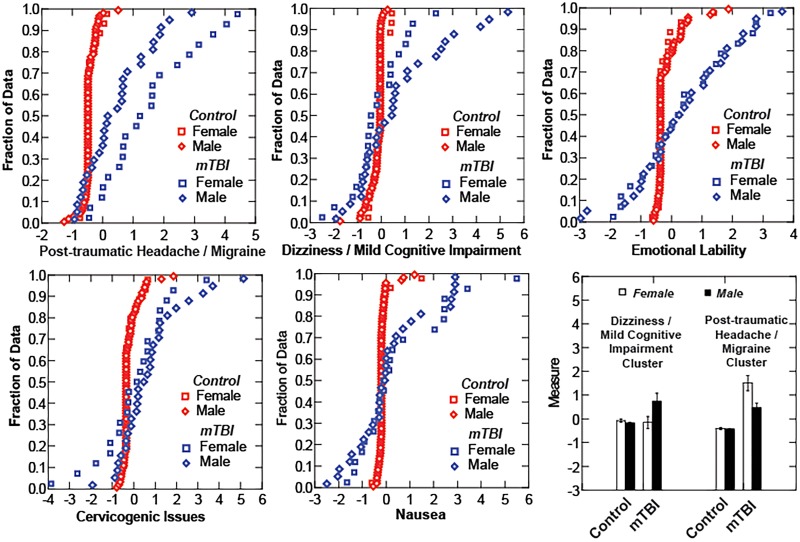
Fig 5. Distribution Scores.
Cumulative distribution scores analyzed by sex of subject. Gray squares (female controls) and gray diamond (male controls) show on difference across symptoms clusters whereas the black squares (female mTBI) and black diamonds (male mTBI) vary across the dizziness/cognitive and headache/migraine clusters.

