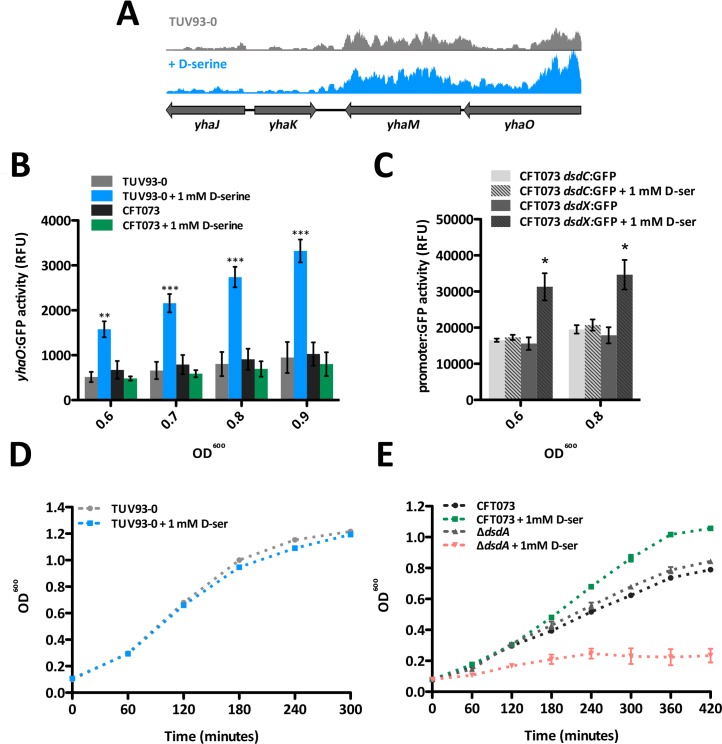
Fig 6. Transcriptional regulation of D-serine uptake in EHEC and UPEC.
(A) Coverage of RNA-seq reads across the yhaOMKJ gene cluster. Data was mapped from previously obtained RNA-seq data that investigated the response of TUV93-0 gene expression to D-serine [21]. The height of coverage peaks has been scaled to that of TUV93-0 using EasyFig [35]. TUV93-0 transcript expression is highlighted in grey whereas TUV93-0 plus D-serine is highlighted in blue. (B) yhaO expression is responsive to environmental D-serine. TUV93-0 and CFT073 were transformed with a plasmid containing a GFP-yhaO promoter fusion (pyhaO:GFP). Activity of the yhaO promoter was measured during growth in relative fluorescence units (RFU) using TUV93-0 alone in MEM-HEPES (grey), TUV93-0 supplemented with 1 mM D-serine (blue) and CFT073 alone (dark grey) or supplemented with 1 mM D-serine (green). Data was calculated from three biological replicates and plotted at increasing OD600 values. ** and *** denote P ≤ 0.01 and P ≤ 0.001 respectively. (C) dsdC and dsdX expression in response to D-serine in UPEC. CFT073 was transformed with pdsdC:GFP (light grey) and pdsdX:GFP (dark grey) transcriptional reporters and activity of measured during growth in MEM-HEPES with and without 1 mM D-serine (clear or dashed bars respectively) as relative fluorescence units (RFU). Data was calculated from three biological replicates. * denotes P ≤ 0.05. (D) Growth curves of EHEC TUV93-0 in MEM-HEPES alone (grey) and supplemented with 1 mM D-serine (blue). (E) Growth curves of UPEC CFT073 and UPEC ΔdsdA in MEM-HEPES alone (black, grey) and supplemented with 1 mM D-serine (green, red). Growth experiments were performed in biological triplicate.

