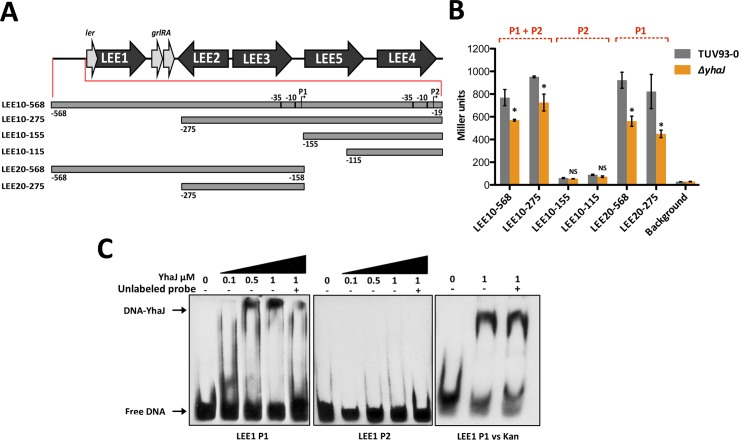
Fig 8. YhaJ directly regulates the LEE in EHEC.
(A) Schematic representation of the LEE pathogenicity island. The master regulator ler upstream regulatory region is expanded to illustrate the rationale behind the design of the nested deletion series to monitor LEE1 promoter activity as described by Islam et al. Promoters P1 and P2 as well as corresponding -10 and -35 elements are indicated. (B) Monitoring the impact of YhaJ on LEE1 expression in TUV93-0. LEE10 and LEE20 plasmids were transformed into TUV93-0 (grey) and ΔyhaJ (orange) and LacZ activity was measured in Miller units at an OD600 of approximately 0.7 during growth in MEM-HEPES. The presence of promoters P1 and P2 in each assay is indicated above the graph. * and NS denote P ≤ 0.05 and no significance respectively and the data was calculated from three biological replicates. (C) Purified YhaJ was tested for its ability to bind the LEE1 P1 and P2 promoter regions by EMSA. DIG-labeled LEE1 P1 and P2 specific DNA probes were incubated with increasing concentrations of YhaJ. A shift in free-DNA that corresponds to a YhaJ-DNA complex was only observed for LEE1 P1 and this was in agreement with the data presented in panel B. Specificity of the binding reaction was tested by the addition of a 100-fold excess (+) of unlabeled P1 or P2 probe to the binding reaction to outcompete binding of the DIG-labeled probe to YhaJ. A 100-fold excess of unlabeled kan probe was also used as a non-specific competitor for YhaJ binding to the P1 region (LEE1 P1 vs kan) to ensure specify of the band shift pattern. EMSA experiments were performed in triplicate to confirm the results.

