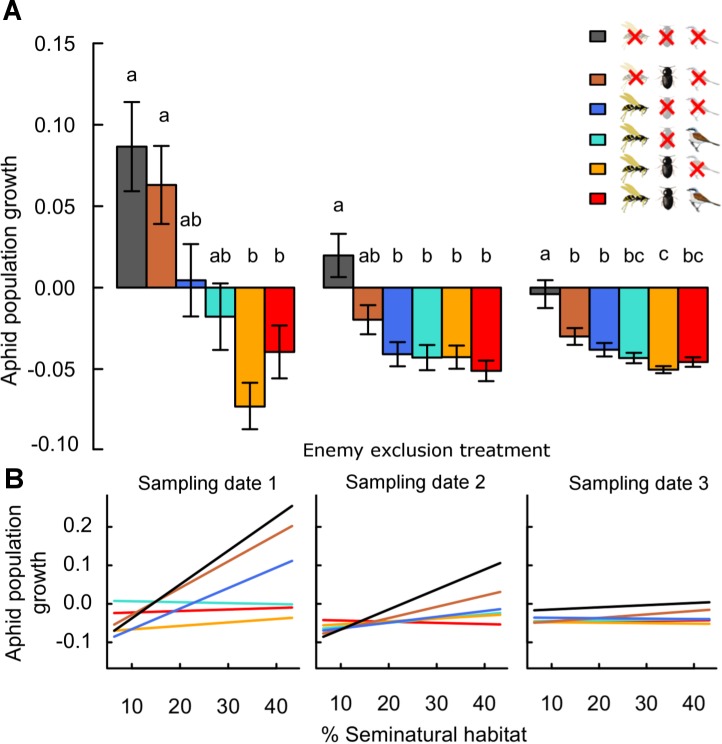
Figure 1. Effects of landscape complexity and natural enemy exclusion on average daily aphid population growth across three sampling dates (1–3).
Average daily population growth is the log-ratio of aphid density on sampling dates 1 to 3 and of initial aphid density, divided by the number of days since the start of the experiment (date 1: after 10 days, date 2: after 20 days, date 3: after 30 days). Part A shows mean growth ± s.e.m. per exclusion treatment and sampling date. Part B shows variation of predicted values across the gradient in landscape complexity, measured by percent seminatural habitat in a 700 m radius around fields. Data points per treatment and date are provided in Fig. S3. See Table S3 for multiple slope comparisons. Different letters indicate significant differences between treatments. In the legend, crossed-out symbols indicate exclusion of natural enemy functional guilds. Treatments remain accessible to non-excluded guilds. Guilds of natural enemies include flying insects (parasitoids, syrphid flies and predatory wasps; wasp symbol), ground-dwellers (carabid beetles, staphylinids and spiders; beetle symbol) and birds (and other vertebrates larger than 1.5 cm; bird symbol).

