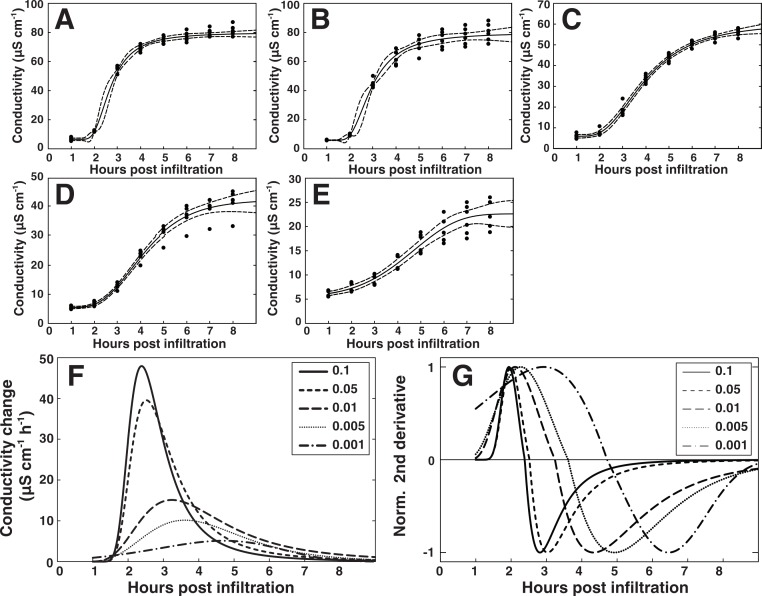
Figure 7. Modeling of the hypersensitive response reveals bacterial dose dependence.
A regression analysis was performed on the electrolyte leakage data from Col-0 presented in Fig. 6A. (A)–(E) Shows functions fitted to the data from the five different titers of P. syringae DC3000 AvrRpm1 where (A) shows OD600 = 0.1, (B) OD600 = 0.05, (C) OD600 = 0.01, (D) OD600 = 0.005, and (E) OD600 = 0.001. The first derivative of the functions displayed in (A)–(E), which shows the rate of change in electrolyte leakage over time, is shown in (F). The second normalized derivative of the functions displayed in (A)–(E) is presented in (G). Dots in (A)–(E) are actual measured values and dashed lines indicate 95% confidence intervals. Modeling was performed on two different data sets with similar results.

