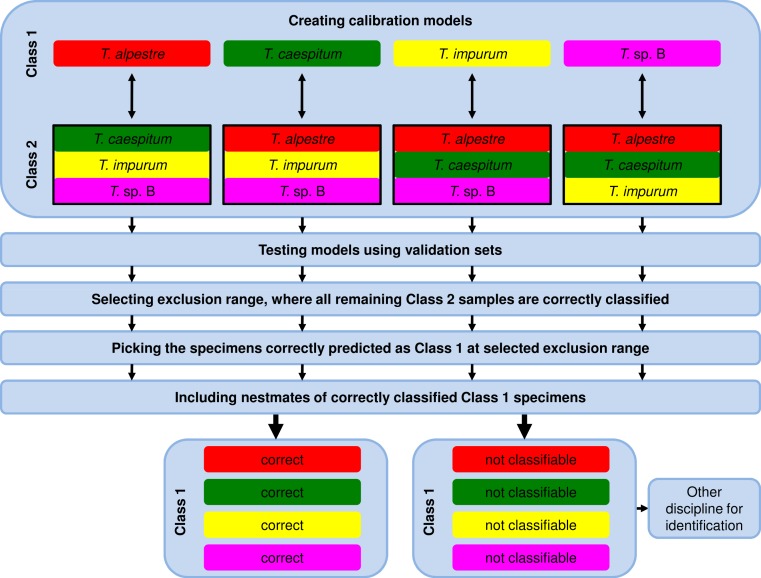
Figure 2. Workflow of data analysis using the one-vs-all strategy.
Models were elaborated, and optimum models were selected and tested using the validation-set prediction accuracy. An exclusion range of prediction values was selected, where all remaining specimens of the Class 2 validation set were correctly classified (exclusion of false positives). As a consequence, the remaining correctly classified Class 1 validation-set specimens (true positives) were unambiguously identified. Nestmates of the recently identified specimens were also treated as correctly identified. All excluded and thus not identified Class 1 validation-set specimens were unidentifiable using NIRS and the one-vs-all approach. Another method for identification is necessary.

