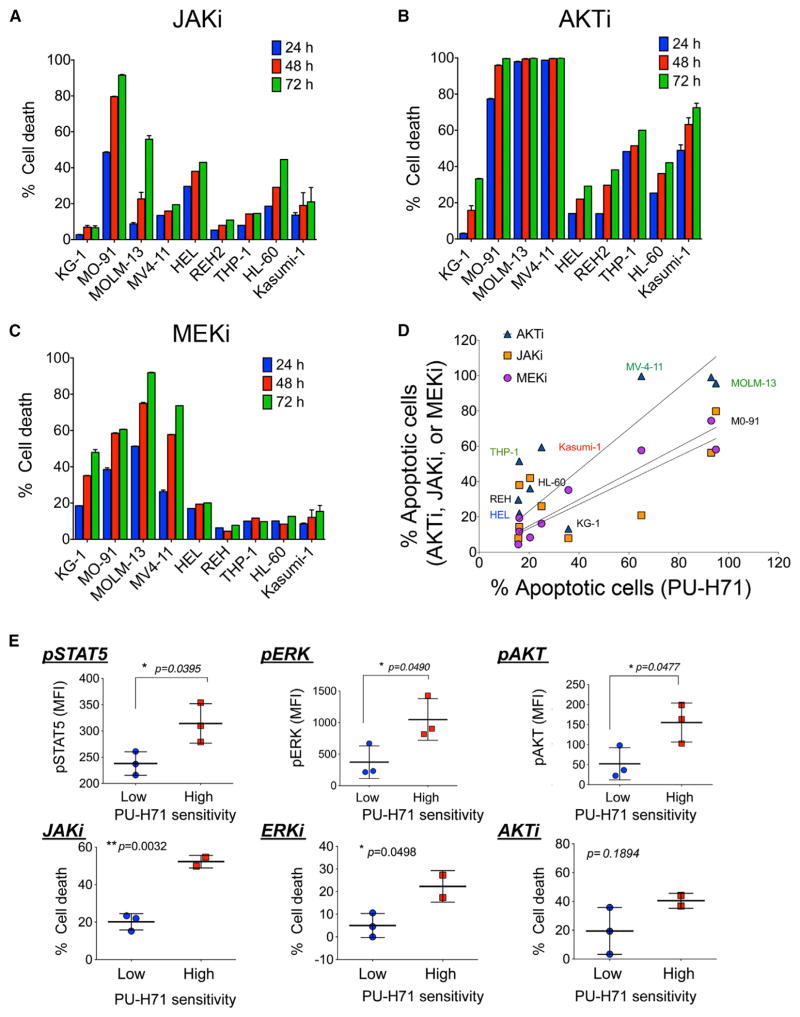
Figure 3. Dependence of AML Cells on Activated PI3K/AKT, JAK/STAT Pathways and teHsp90 Overlaps.
(A–C) Percent cell death relative to untreated control evaluated at the indicated time points for a panel of leukemia cell lines treated with (A) 0.5 μM JAK1/2 inhibitor (JAKi), (B) 5 μM AKT inhibitor (AKTi), or (C) 20 μM MEK1/2 inhibitor (MEKi).
(D) The apoptotic sensitivity of AML cells lines to PU-H71 (x axis) and to AKTi, JAKi, or MEK1/2i (y axis).
(E) (Top) Levels of pSTAT5, pERK, and pAKT evaluated by phosphoflow in primary AML samples with low or high PU-H71 apoptotic sensitivity. (Bottom) Percent cell death after 48 hr treatment with JAKi, MEKi, or AKTi. Each symbol represents an individual sample. Values denote mean ± SEM. *p < 0.05 and **p < 0.01. See also Figure S3.

