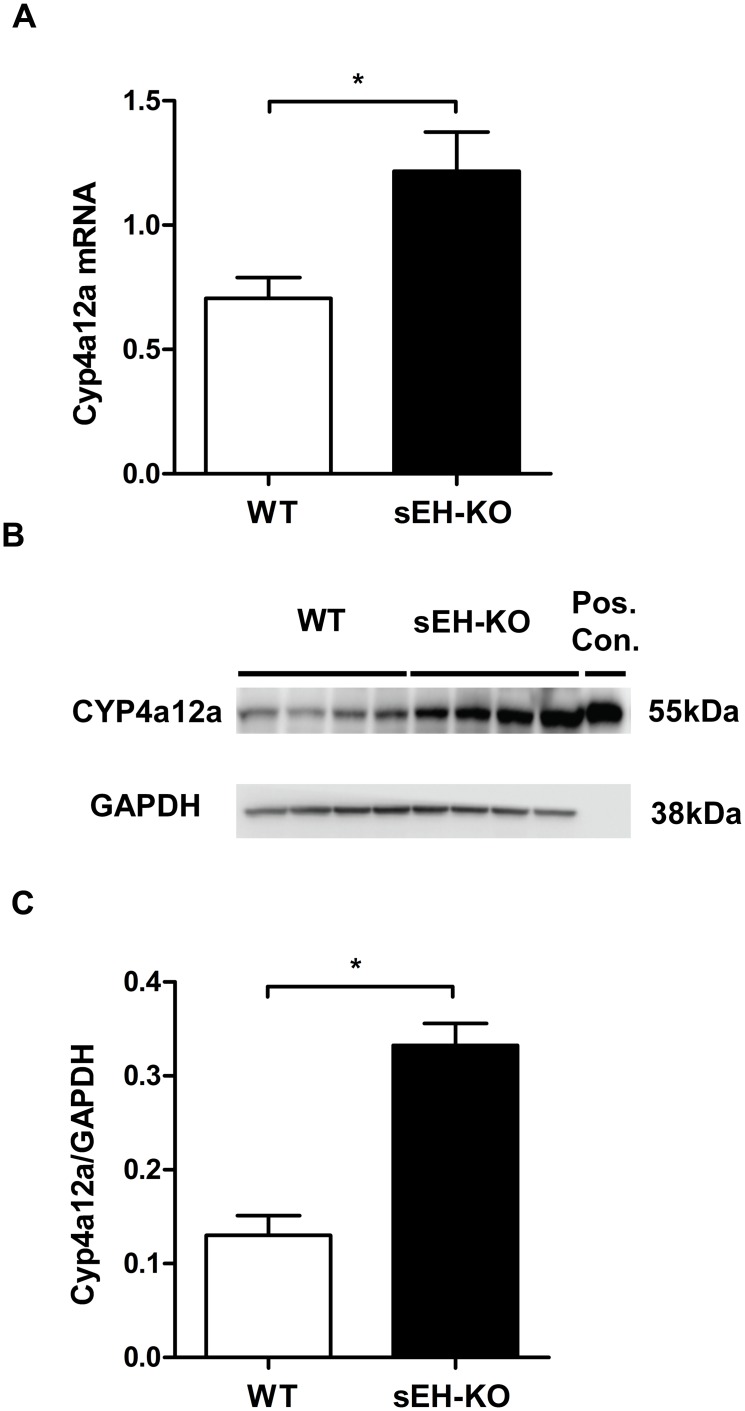
Fig 9. Upregulation of renal Cyp4a12a expression in sEH-KO mice.
(A): Quantification of Cyp4a12a mRNA expression in kidneys of WT and sEH-KO mice by TaqMan RT-PCR. (B): A representative Western blot comparing the renal expression of Cyp4a12a protein in WT and sEH-KO mice. (C): Quantification of immunoreactive bands showed 2.5-fold higher Cyp4a12a protein levels in the kidneys of sEH-KO compared to WT mice. Real time-PCR data (A) and Western blot data (C) are given as mean ± SEM (n = 5–7 group). Statistically significant differences were observed as indicated: * p<0.05 vs WT.

