
Fig 1. R h comparison to number of residues, N. Filled and open circles represent experimental R h for IDPs [23,26–42] and folded proteins [22,45,46], respectively.
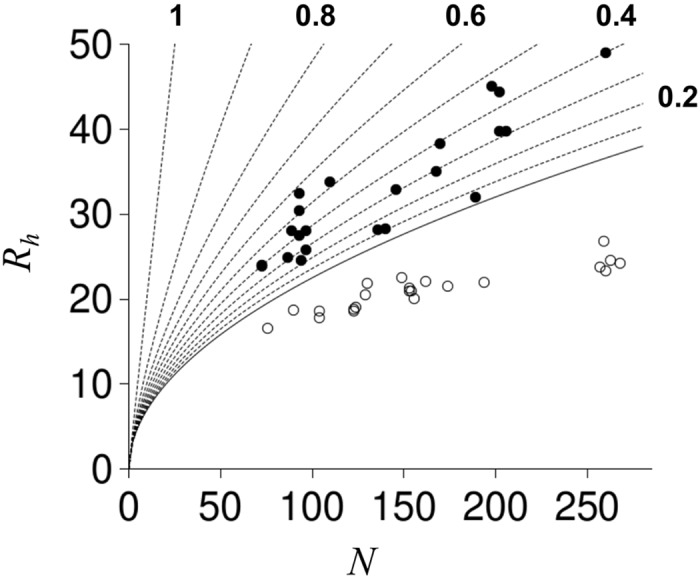
The solid line is the R h dependence on N estimated from simulations of randomly configured protein structures [22]. Stippled lines show R h for randomly configured structures with chain propensities for PP II (f PPII) from 0.1 to 1 in 0.1 increments. Every other stippled line is end-labeled by its f PPII value.