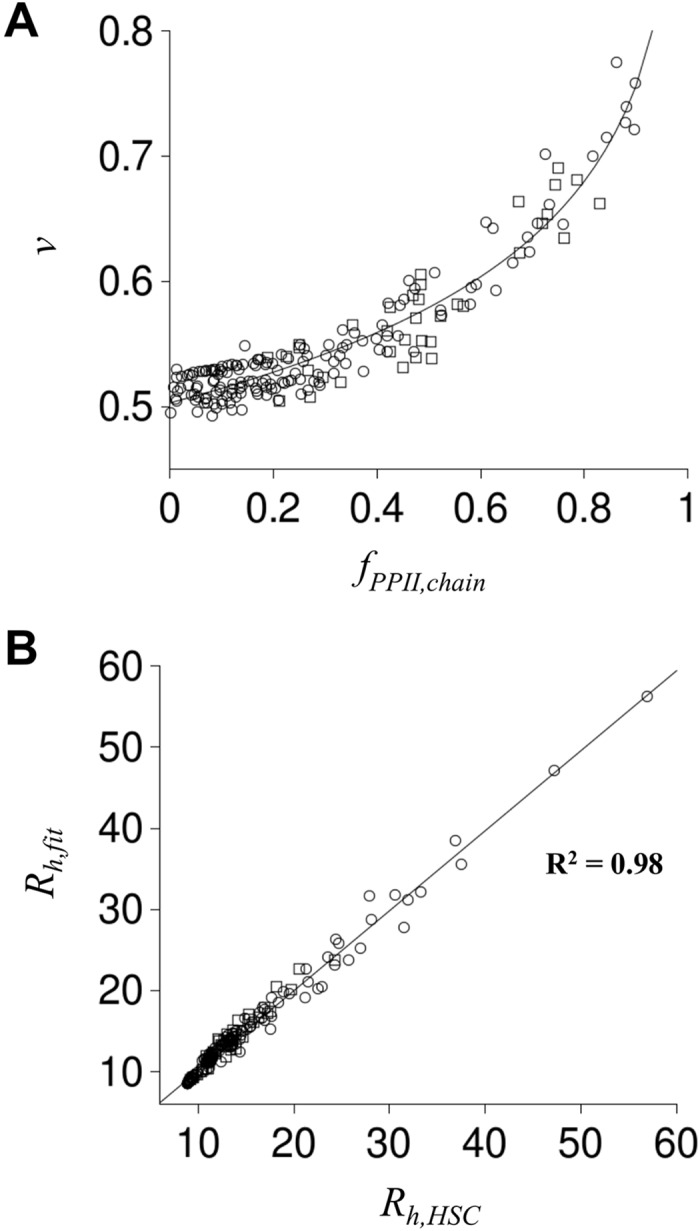
Fig 2. Simulated effect of PP II propensities on coil R h.

Each circle and square represents a simulated disordered polypeptide. Squares are from ensembles simulated with position-specific PP II propensities assigned randomly; circles had PP II propensity assignments that followed the sequence patterns described in the text. In panel A, f PPII,chain was calculated as <N PPII>/N, where <N PPII> was the ensemble averaged number of residues with (Φ,Ψ) in the PP II region (-75±10, 145±10), and v was calculated as ln(R h/R o)/ln(N) using <L>/2 for R h and 2.16 Å for R o. These data were fit to v = v o + β∙ln(1-f PPII,chain), with v o and β as fit parameters, producing the solid line. In panel B, R h,HSC was calculated as <L>/2. R h,fit was determined from f PPII,chain using R h,fit = (2.16 Å)∙N v and the panel A fit for v. R h,HSC and R h,fit correlation (R2) is provided in the figure.
