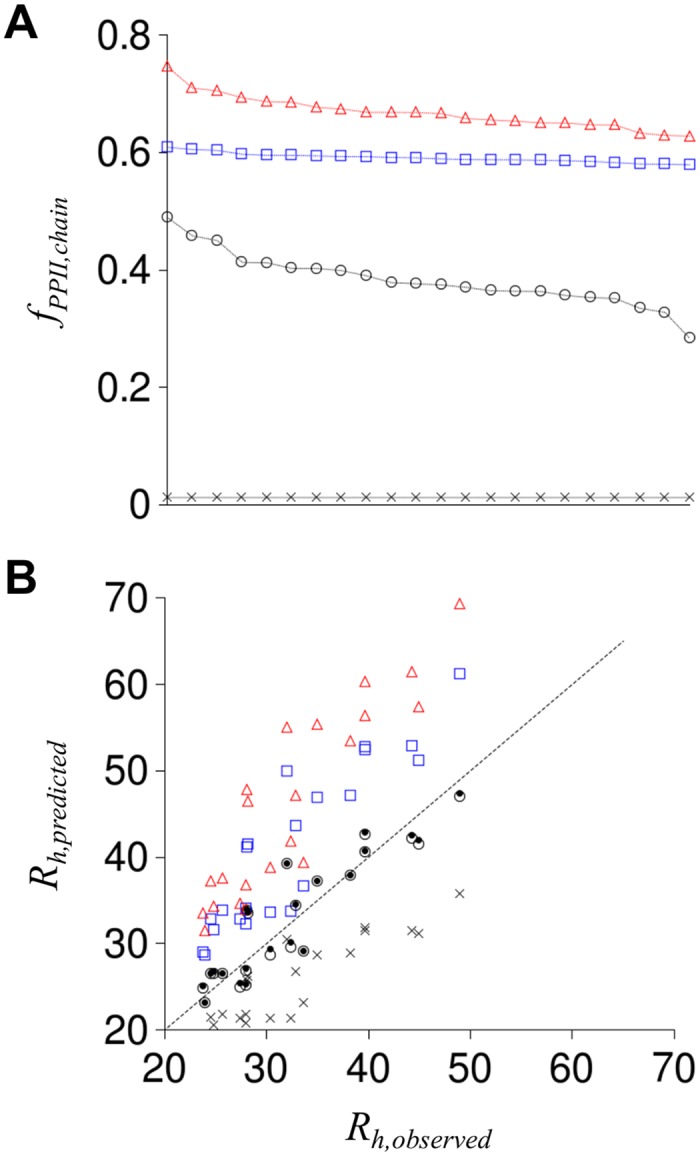
Fig 3. Chain propensity for PP II from experimental scales and comparison of predicted and observed R h.

Panel A gives f PPII,chain for each IDP sequence, ordered left to right to show the range obtained with each scale, calculated using experimental PP II propensities from Kallenbach (red triangles), Creamer (blue squares), and Hilser (open circles). X is f PPII,chain from the null model. Panel B shows R h predicted for each IDP using Eq (6) and f PPII,chain from panel A. Symbols in panel B match panel A representations. Black dots show R h predicted from the composite propensity scale. Stippled line is the identity line.
