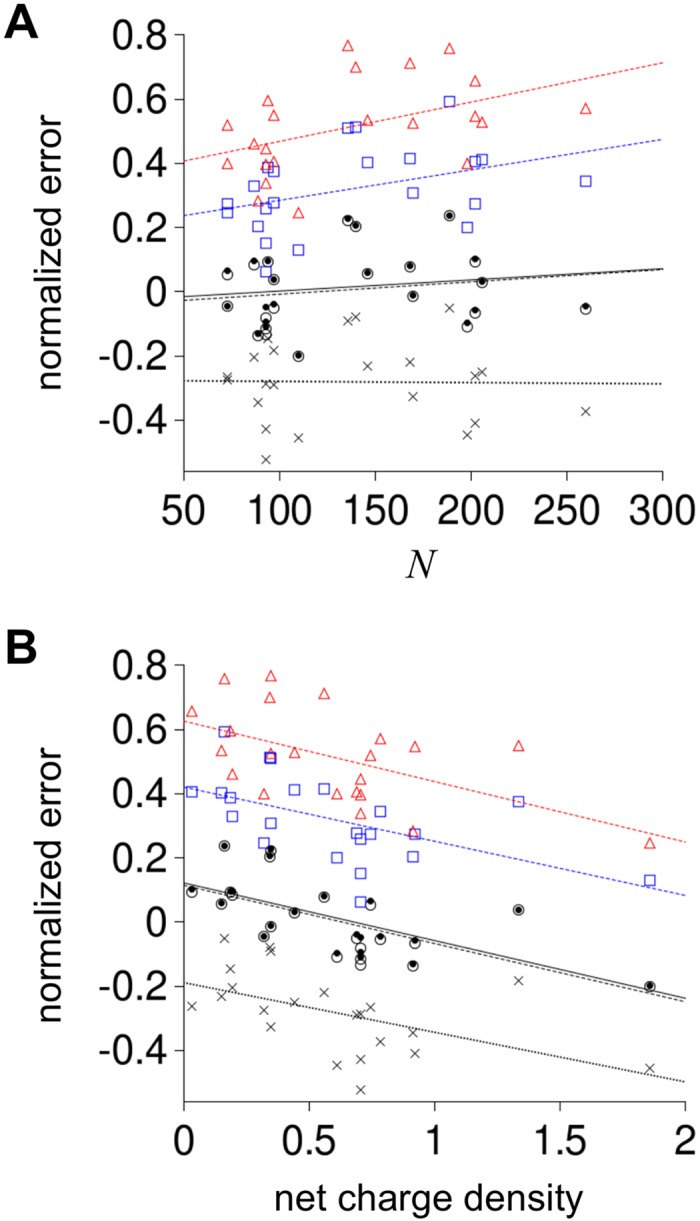
Fig 4. Correlation of normalized error in predicted R h to N and net charge density.

Normalized error and net charge density were calculated for each IDP using Eqs (7) and (8), respectively. In both panels, red triangles show normalized error from R h predicted using the Kallenbach reported propensities, blue squares from Creamer reported propensities, open circles from Hilser reported propensities, black dots from the composite propensity scale, and X is the null model. Lines are linear fits to the five prediction sets colored as the symbols (Kallenbach scale was red; Creamer was blue, Hilser was stippled black, composite was solid black, and null was dotted black).
