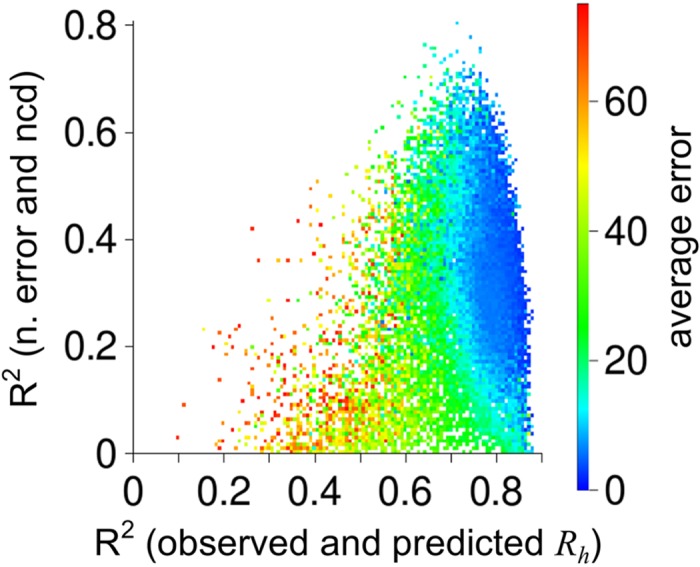
Fig 5. R h prediction from random PP II propensity scales.

Random scales were generated as described in the text and used to predict R h for each IDP by Eq (6). Shown is the correlation (R2) obtained for each scale between observed and predicted R h plotted against the correlation obtained between the normalized error (n. error) and the net charge density (ncd). Shown by color is the average prediction error of each scale. Random scales giving average prediction error larger than 75 Å were omitted to emphasize differences at lower error values.
