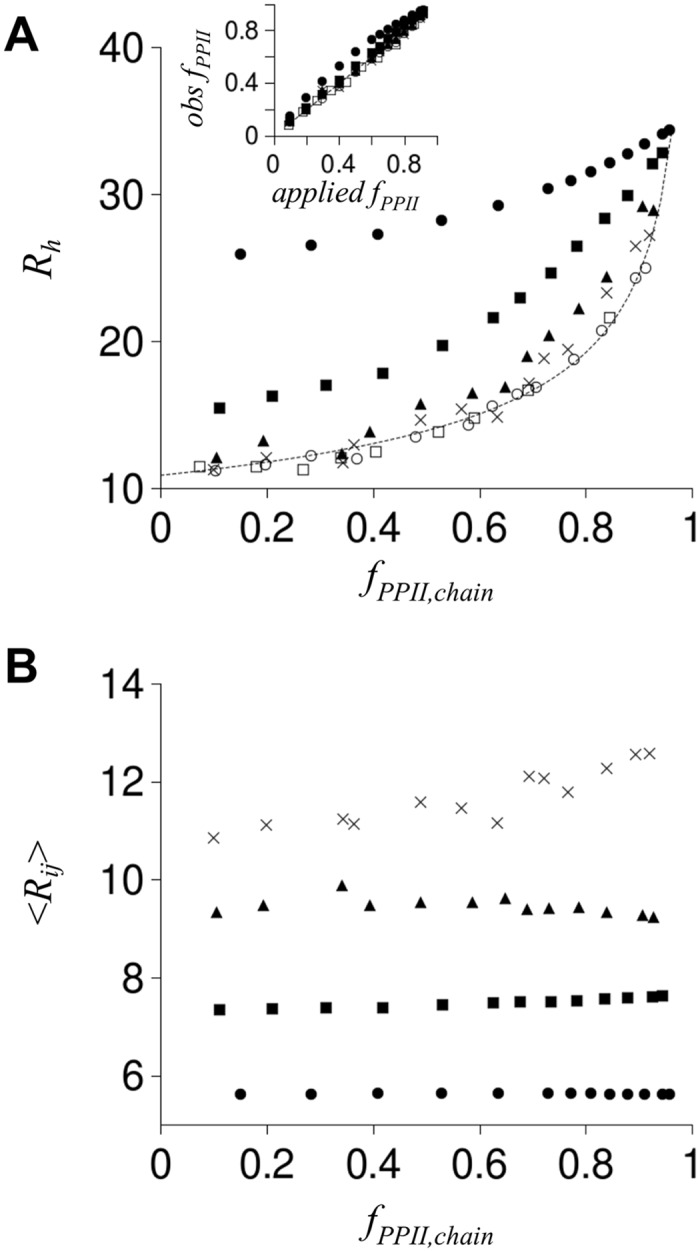
Fig 6. Simulated effect of charged residues on R h.

In panel A, the stippled line is R h from Eq (6) with N = 25 and f PPII,chain = 0–0.98. Plotted symbols are R h from poly-ALA simulations (N = 25) calculated using Eq (3). Open squares are uncharged poly-ALA and open circles have charged termini. Filled circles have each residue modeled with negative charge at the Cβ atom. Filled squares have every other residue modeled with negative charge, filled triangles have every third residue with negative charge, and X is every fourth residue with negative charge. In panel B, <R ij> is the ensemble averaged distance (in Å) between Cβ atoms from two charged residues, i and j, closest in sequence. Panel B symbols match panel A representations. A inset: comparison of observed f PPII,chain (shown as obs f PPII) to f PPII,chain expected from the applied S PPII (shown as applied f PPII; calculated as f PPII = S PPII − 0.062∙exp(-(S PPII-0.63)2/(2∙0.282)) [22]. Note that filled circles trend higher than other plotted data. Inset symbols match panel representations.
