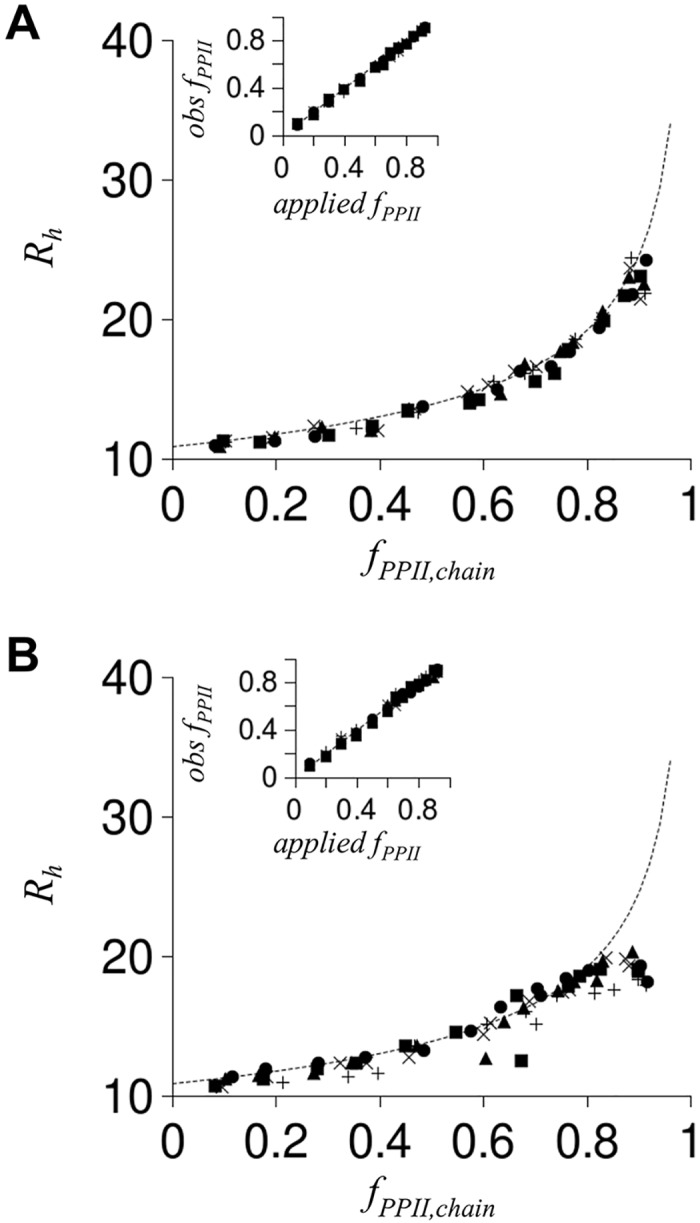
Fig 8. Simulated effect on R h from oppositely charged residues.

Stippled line in each panel was reproduced from Fig 6A. As in Fig 6A, R h was calculated from poly-ALA simulations with N = 25. Charge was modeled with opposite charge at adjacent residue positions (panel A) or adjacent clusters (panel B). In panel A, filled circles have each residue modeled with charge at the Cβ atom (first residue negative, second residue positive, third residue negative, etc.). Filled squares have every other residue modeled with charge (first residue negative, third residue positive, etc.), filled triangles have every third residue modeled with charge, and X represents every fourth residue modeled with charge. In panel B, each residue in a cluster had identical charge while clusters adjacent in sequence had opposite charge. Filled circles are poly-ALA with every residue charged (i.e., residues 1–3 having negative charge, residues 4–6 with positive charge, residues 7–9 with negative charge, etc.). Charge clusters separated in sequence by two uncharged residues are shown with filled squares (i.e., residue 1–3 with negative charge, residues 4–5 uncharged, residues 6–8 with positive charge, etc.) whereas charge clusters separated by four uncharged residues are shown by filled triangles. X and + symbols represent charge clusters separated by six and eight uncharged residues, respectively. Insets: comparison of observed f PPII,chain to f PPII,chain expected from the applied S PPII (following Fig 6A inset description). Inset symbols match panel representations.
