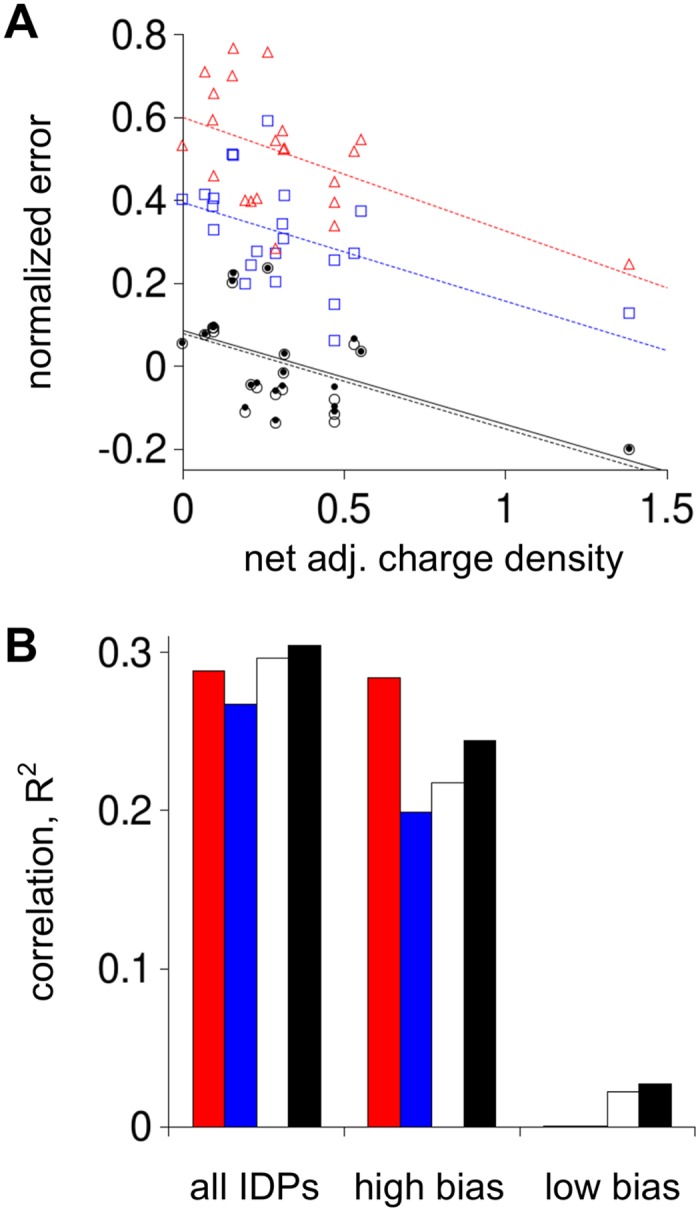
Fig 9. Correlation of normalized error in predicted R h to net adjacent charge density.

Panel A symbols and lines match their Fig 4 representations. Panel B shows correlations (R2) between normalized error and net adjacent charge density for all IDPs, IDPs in the high charge bias group (labeled as “high bias”), and IDPs in the low charge bias group (labeled as “low bias”). Red columns are correlations from using the Kallenbach propensity scale to predict R h, blue from using the Creamer propensities, white the Hilser propensities, and black the composite propensity scale.
