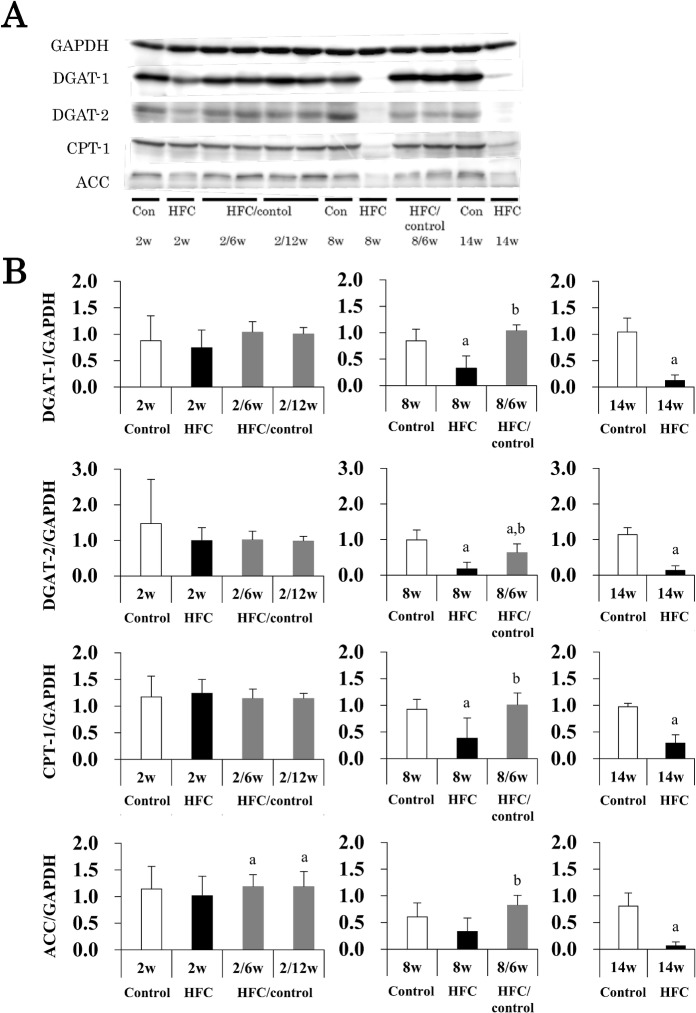
Fig 3. Effects of dietary intervention on lipid metabolism.
Hepatic DGAT-1, DGAT-2, CPT-1, and ACC protein levels were analyzed by Western blotting (A), means and SD (n = 6) were shown by columns and bars, respectively (B). GAPDH was used as a loading control. P < 0.05 was used as a criterion of statistical significance. a Significantly different from the control rats of the same age. b Significant differences were observed between control diet intervention for 6 or 12 weeks and HFC diet feeding after 2 or 8 weeks.

