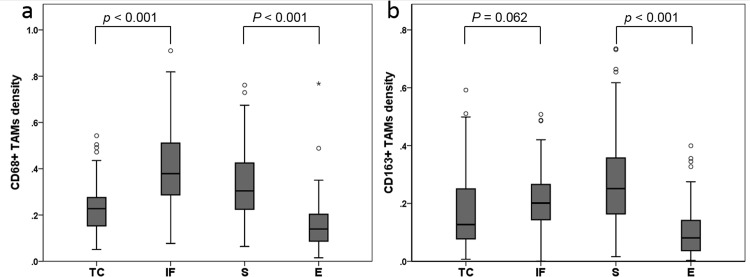
Fig 5. Box plots comparing the density of CD68+ or CD163+ TAMs according to different tumor areas (TC, IF, S and E).
(a) The density of CD68+ TAMs was significantly higher in IF and S rather than in TC and E, respectively. (b) The density of CD163+ TAMs tends to be higher in IF than in TC and is significantly higher in S than in E. Statistical significance was evaluated using a Wilcoxon signed-rank test. Abbreviations: TC, tumor center; IF, invasive front; S, stroma; E, epithelium.

