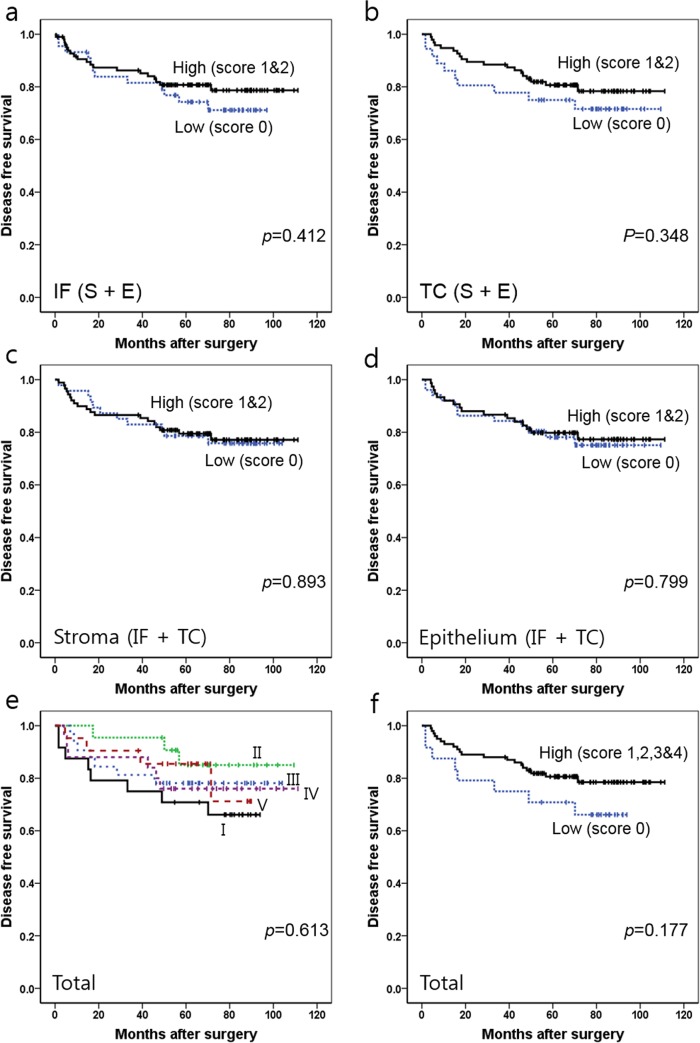
Fig 6. Kaplan-Meier survival analysis with log-rank test of CD68+ TAMs.
(a) Survival curves of the low density (score 0) (n = 44) vs. high density (score 1 and 2) (n = 98) groups in IF (SIF + EIF). (b) Survival curves of the low density (score 0) (n = 36) vs. high density (score 1 and 2) (n = 95) groups in TC (STC + ETC). (c) Survival curves of the low density (score 0) (n = 47) vs. high density (score 1 and 2) (n = 89) groups in S (SIF+STC). (d) Survival curves of the low density (score 0) (n = 51) vs. high density (score 1 and 2) (n = 75) groups in E (EIF+ETC). (e) Survival curves of five subgroups determined by the total score in four combined areas (SIF + STC + EIF + ETC) (I, score 0 (n = 24); II, score 1 (n = 22); III, score 2 (n = 32); IV, score 3 (n = 25) and V, score 4 (n = 21)). (f) Survival curves of the low density (score 0) (n = 24) vs. high density (score 1–4) (n = 100) groups in four combined areas (SIF + STC + EIF + ETC). Abbreviations: TC, tumor center; IF, invasive front; S, stroma; E, epithelium.

