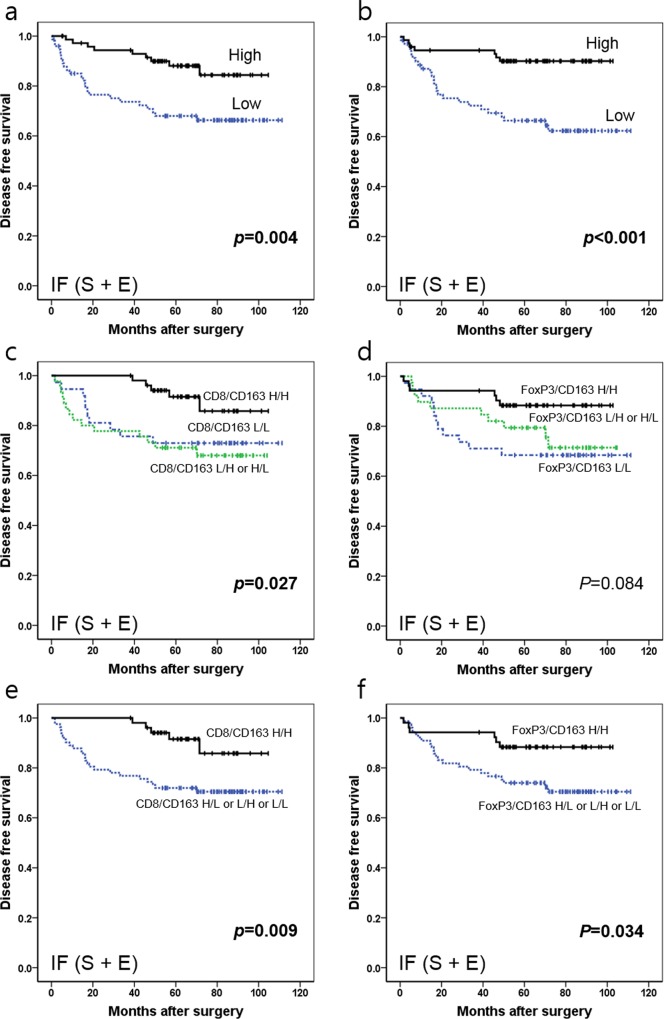
Fig 9. Kaplan-Meier survival analysis with log-rank test according to combinatory statuses of CD8+ or FoxP3+ TILs and CD163+ TAMs.
(a) Survival curves of the low density (n = 70) vs. high density (n = 73) groups of CD8+ TILs in IF. (b) Survival curves of the low density (n = 72) vs. high density (n = 71) groups of FoxP3+ TILs in IF. (c) Survival curves of CD8+high /CD163+high (n = 52) vs. CD8+high / CD163+low or CD8+low /CD163+high (n = 45) vs. CD8+low /CD163+low (n = 37) (d) Survival curves of FoxP3+high /CD163+high (n = 52) vs. FoxP3+high / CD163+low or FoxP3+low /CD163+high (n = 39) vs. FoxP3+low /CD163+low (n = 38). Abbreviations: TIL, tumor infiltrating lymphocyte; TC, tumor center; IF, invasive front; S, stroma; E, epithelium; H, high density; L, low density.

