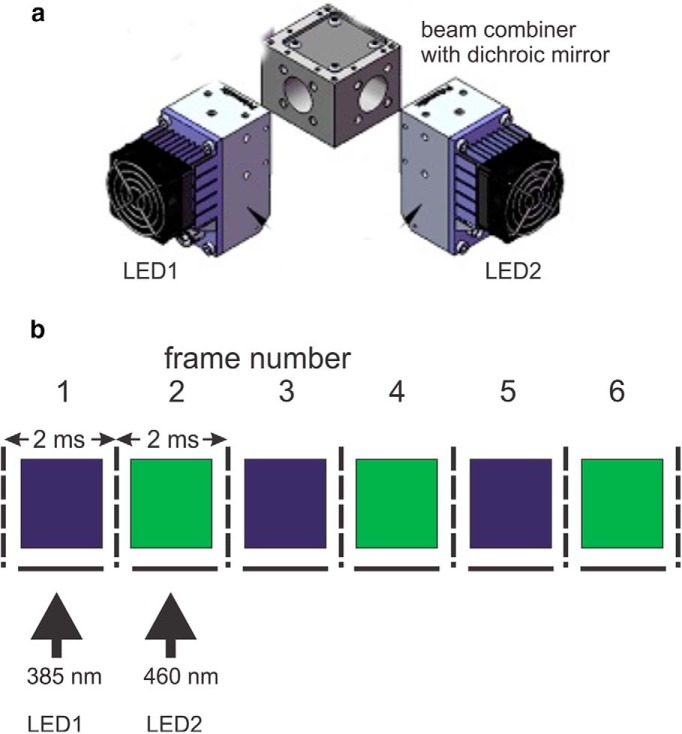
Figure 2.
a, Arrangement of LEDs at the excitation port of the microscope fluorescence illuminator. The outputs of the two LEDs are combined with a dichroic mirror centered at 425 nm. b, Spectra of LEDs used in our experiments (from Prizmatix catalogue). They are nominally centered at the indicated wavelengths but each emits some light over a 50–100 nm range. Below the spectra are the bandpass ranges of excitation filters used to limit the excitation light. The sequence of frame illumination in a typical experiment; at 500 Hz each frame has duration of 2 ms (dotted vertical lines). The LED turns on 0.1 ms after the start of the frame and turns off 0.1 ms before the end of the frame. In the next frame, the second LED is on for the same duration. This alternating sequence continues for the duration of the trial. A similar arrangement was used when pairing the 385 and 520 nm LEDs.

