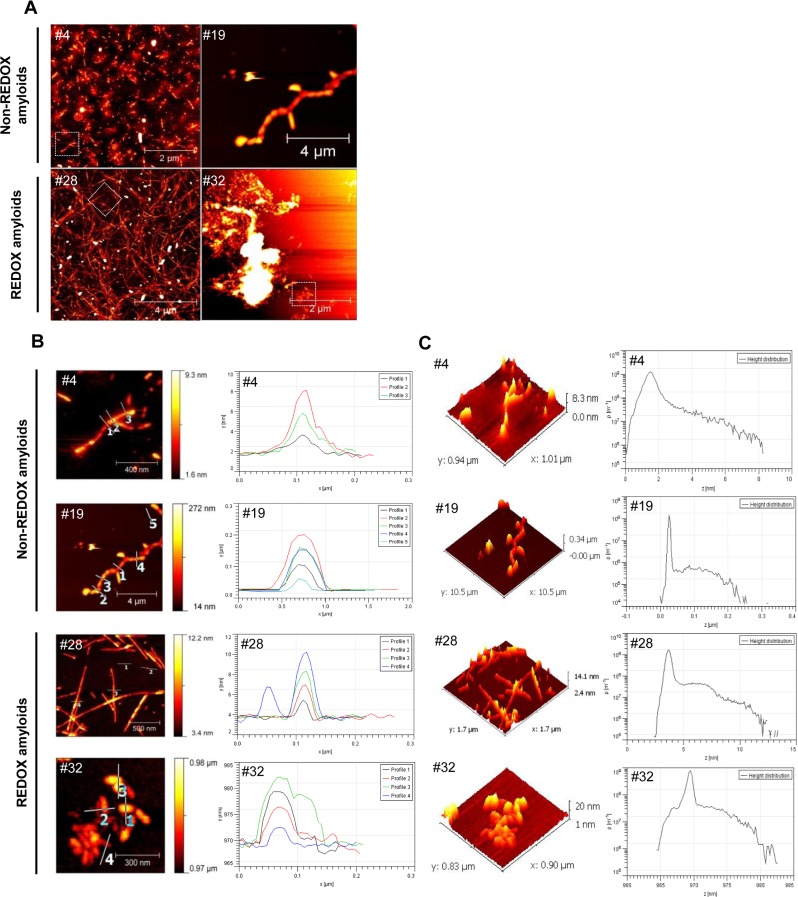
Fig 2. AFM characterization of amyloid fibrils.
Atomic Force Microscopy (AFM) imaging analysis was performed at the end of the fibrillization reactions after 72 hours (amyloids #4, #19, #28, #32). AFM scan topographical images of prion protein (PrP) deposited on mica surface, large-scale images (A). AFM height profiles along the numbered lines in topographical images. The profile reflects the lines as numbered in the images. Higher resolution scan images belonging to the area are marked by a white dashed square in part A (B). Three-dimensional representation of AFM topography images and height distribution data obtained from the AFM images in part B (C).

