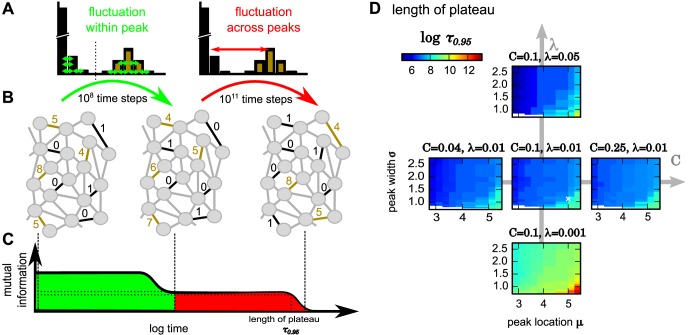
Fig 4. Schematic diagram of the dynamics underlying long-lasting memory and influences of parameters on storage time.
(A-C) The different phases (green, red) of decay in mutual information can be explained by within peaks versus across peaks redistribution of synapses. (D) The period until the plateau of mutual information has decayed to 95% of its initial value (color code, on a logarithmic scale) depends on the parameters of the bimodal wp stationary distribution of synapses. White cross in center panel marks parameters used in Figs 2 and 3.

