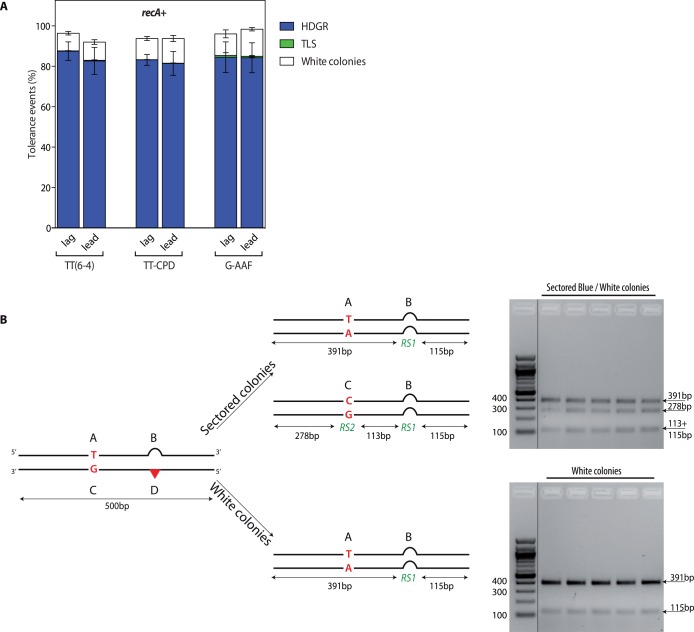
Fig 2. Partitioning of DDT pathways in the recA + strain (panel A) and molecular characterization of the colonies (panel B).
A) The graph represents the partition of DDT pathways for two UV lesions, TT(6–4) and TT-CPD, and for the chemical adduct G-AAF, relative to lesion-free plasmid in a recA +. Each lesion has been inserted in both orientations with respect to fork direction, i.e. leading (lead) and lagging (lag). Tolerance events (Y axis) represent the percentage of cells able to survive in presence of the integrated lesion compared to the lesion-free control. The data represent the average and standard deviation of at least three independent experiments. B) The digestion profile of a sectored or a white colony is represented. A 500bp PCR fragment including all four genetic markers is digested by SspI and PvuII, in the case of UV lesion constructions, or by EcoRI and PvuII, in the case of AAF lesion construction. RS1 = SspI or EcoRI; RS2 = PvuII.

