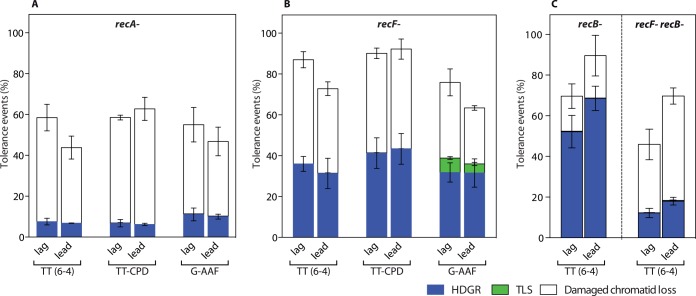
Fig 3. Partitioning of DDT pathways in homologous recombination impaired strains.
The graph represents the partition of DDT mechanisms for two UV lesions, TT6-4 and TT-CPD, and for the chemical adduct G-AAF, relative to lesion-free plasmid, in a recA- strain (A), in a recF- strain (B), and for the TT6-4 lesion in a recB- and recB-recF- strain (C). Each lesion has been inserted in both orientation of the replication fork, i.e. leading (lead) and lagging (lag). Tolerance events (Y axis) represent the percentage of cells able to survive in presence of the integrated lesion compared to the lesion-free control. The data represent the average and standard deviation of at least three independent experiments.

