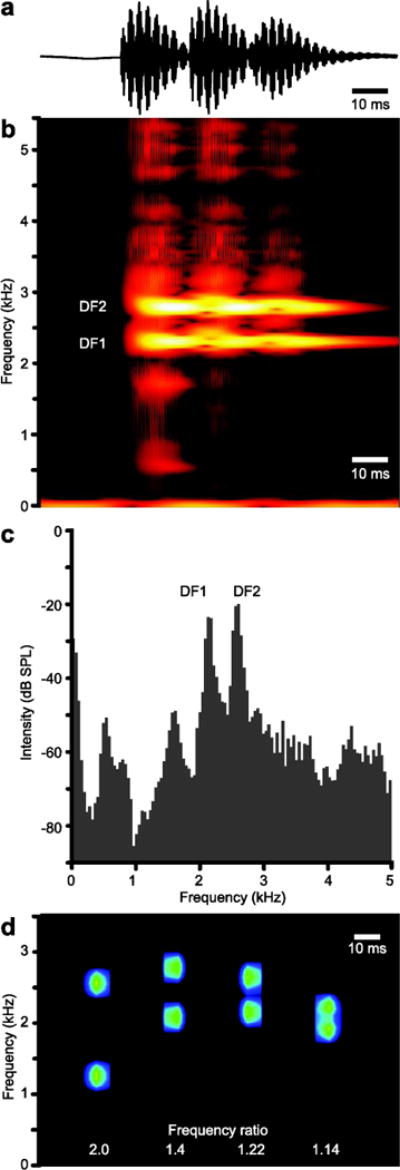
Fig. 1.

a) An oscillogram of three sound pulses from a male X. petersii call. The spectrogram (b) and frequency power spectrum (c) of the call in (a) illustrates the two, distinct frequencies of high intensity within each pulse. The lower frequency is DF1, the higher DF2. d) A spectrogram of the synthetic SODs for X. borealis, X. amieti, X. petersi, and X.amieti (left to right) with the frequency ratio identified below each sound pulse. In this spectrogram, intensity is coded in blue-green instead of red-yellow (as in b) to distinguish the in vitro and in vivo sound sources.
