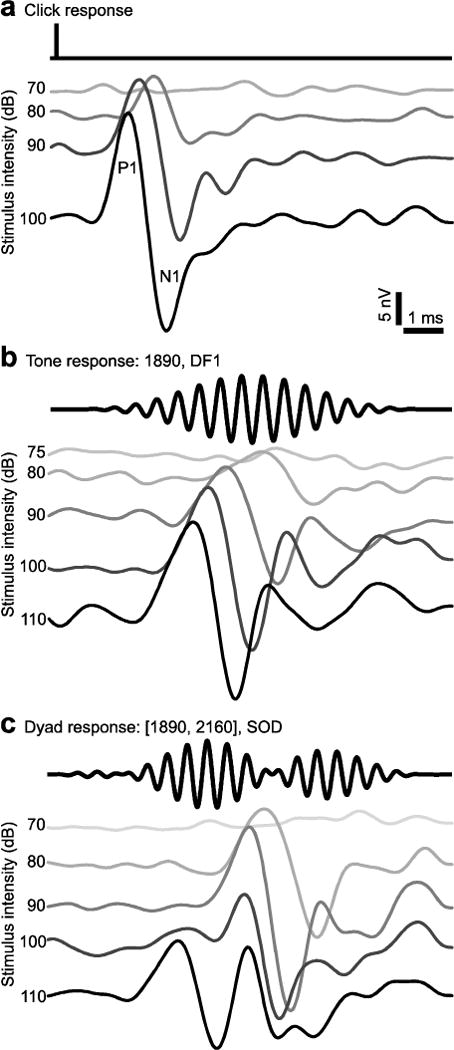
Fig. 2.

AEPs from a single X. laevis female (DF1: 1890, DF2: 2160, Frequency ratio: 1.14) illustrate the differences between responses to clicks (a), tones (b), and dyads (c). Oscillograms of stimuli are in black above each waterfall plot, stimulus intensities are to the left of each AEP. The first positive (P1) and negative (N1) peaks are indicated in (a).
