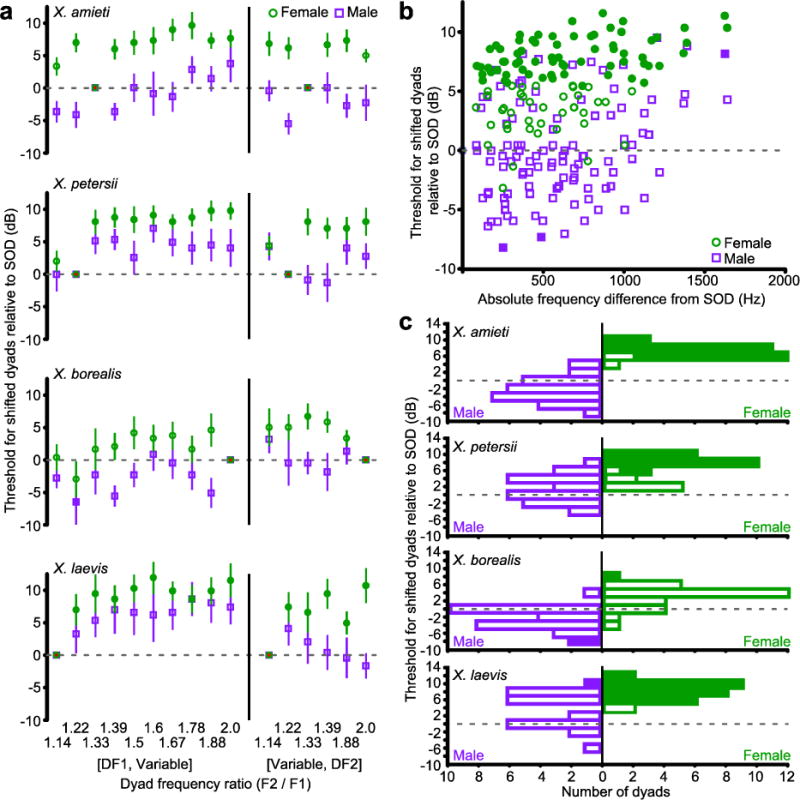
Fig. 3.

a) AEP thresholds for dyads containing at least one DF from the SOD, in females (green circles) and males (purple squares). Filled symbols indicate thresholds that differ significantly from the SOD threshold (Repeated Measures ANOVAs with Dunnett’s multiple comparisons post hoc, all p < 0.05). The dashed line indicates the threshold for the SOD. Error bars indicate standard error. b) The absolute frequency difference from SOD was calculated as the sum of the absolute differences between each DF and the closest frequency in the altered dyad. All dyads (not just the DF1 or DF2 manipulations shown in (a)) are illustrated and species are grouped using the color conventions in (a). c) The data in (b) presented as a histogram of thresholds for all dyads relative to the threshold for SOD by species. For female Xenopus (green), thresholds for most other dyads are significantly higher (Filled blocks represent dyads with thresholds significantly different from the SOD (dashed line).
