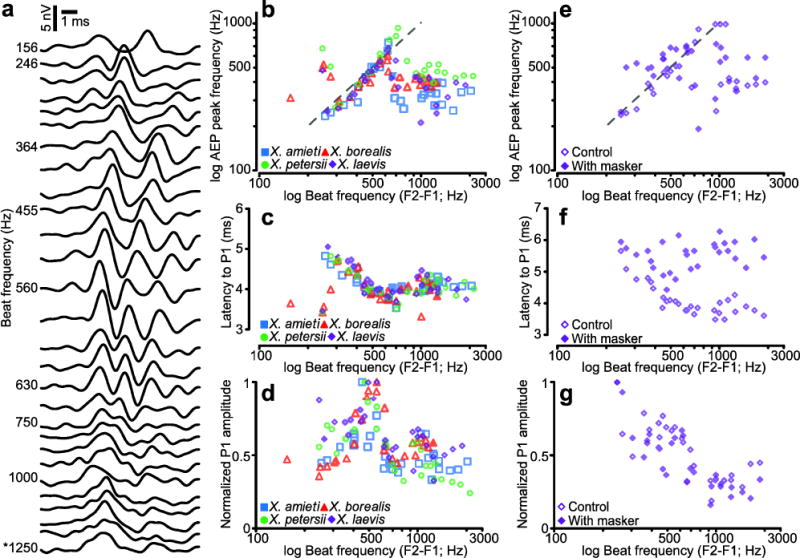
Fig. 7.

AEP waveforms varied with the beat frequency of dyads. a) A waterfall plot of averaged female X. borealis AEPs with increasing beat frequency (F2–F1) towards the bottom. The asterisk indicates the AEP to the SOD. b) The correlation between the frequency of AEP peaks (P1, P2) and the beat frequency of the dyad from 200–700 Hz. The dashed line is y = x. The correlation between beat frequency and P1 latency (c) and P1 amplitude (d) are also plotted. The SOD for each species is indicated by the filled symbol. e, f, and g plot AEP peak frequency, P1 latency, and amplitude, respectively, using the same conventions as b, c, and d. This subset of animals was exposed to dyads alone (open symbols) and in the presence of a 100–800 Hz masker (filled symbols).
