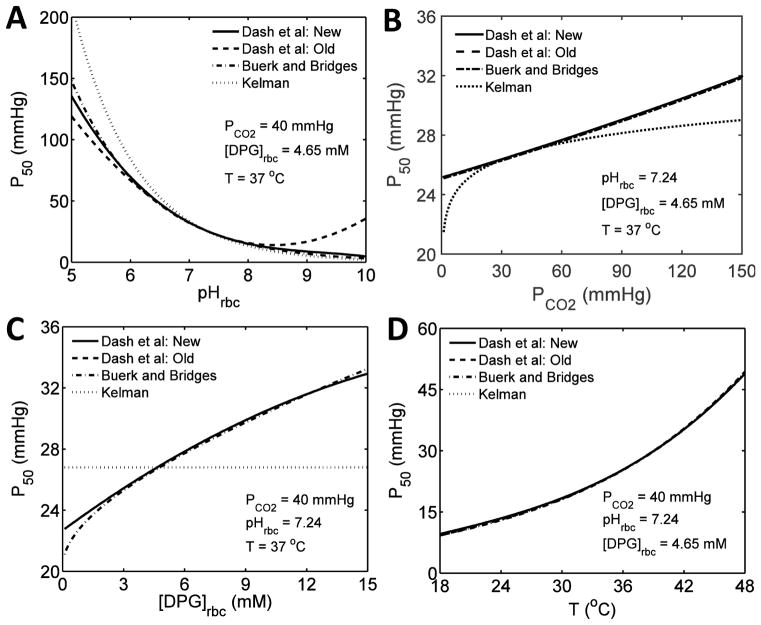
Figure 2. Comparison of P50 values under various physiological conditions based on simulations of different P50 models.
(A–D) Comparison of the modified P50 model (Eqs. 9 and 10) with the previous P50 models from the literature (Kelman, 1966b; Buerk & Bridges, 1986; Dash & Bassingthwaighte, 2010), in which the model-simulated P50 values are plotted as functions of one variable with the other variables fixed at their standard physiological values; i.e. P50 as a function of pHrbc (A), PCO2 (B), [DPG]rbc (C), and T (D). The P50 values have been computed from Eqs. 9 and 10 under varying physiological conditions with appropriate multiplicative factors (0.833, 0.588 and 1.02 for P50,ΔpH, P50,ΔCO2 and P50,ΔT, respectively) to allow a comparison with the previous models, which have not been adjusted to account for the data of Joels and Pugh (1958), Naeraa et al. (1963), Hlastala et al. (1977) and Reeves (1980).

